Sandfire Resources America Inc (SFR : TSX-V)
Common Stock
$0.27
CAD
-0.10 (-28.38%)
Last updated: 2026-07-20
SFR
Sandfire Resources America Inc
 WealthAwesome
Performance
1 Day
-28.38%
1 Week
+23.26%
1 Month
+39.47%
YTD
-17.19%
Key Statistics
Market Cap
$378.64M
52W High
$0.48
52W Low
$0.19
P/E Ratio
-
50 Day MA
$0.22
200 Day MA
$0.28
Beta
1.40
Dividend Yield
-
Technical Indicators
Price vs 50-Day SMA
Price vs 200-Day SMA
Recent Price History
| Date | Open | High | Low | Close | Adj Close | Volume |
|---|---|---|---|---|---|---|
| 7/20/2026 | $0.36 | $0.36 | $0.26 | $0.27 | $0.27 | 91,650 |
| 7/17/2026 | $0.22 | $0.58 | $0.22 | $0.37 | $0.37 | 177,094 |
| 7/15/2026 | $0.22 | $0.22 | $0.22 | $0.22 | $0.22 | 1,028 |
| 7/10/2026 | $0.21 | $0.21 | $0.21 | $0.21 | $0.21 | 21,000 |
| 7/8/2026 | $0.20 | $0.20 | $0.20 | $0.20 | $0.20 | 5,000 |
| 7/7/2026 | $0.20 | $0.20 | $0.20 | $0.20 | $0.20 | 10,000 |
| 7/3/2026 | $0.20 | $0.20 | $0.20 | $0.20 | $0.20 | 0 |
| 7/2/2026 | $0.20 | $0.20 | $0.20 | $0.20 | $0.20 | 500 |
| 6/30/2026 | $0.20 | $0.20 | $0.20 | $0.20 | $0.20 | 5,000 |
| 6/29/2026 | $0.20 | $0.20 | $0.20 | $0.20 | $0.20 | 0 |
Wealth Awesome Price Forecast
WA ModelStatistical 90-day price range based on SFR's historical volatility
30-Day Vol
191.7%
Annualized
90-Day Vol
142.4%
Annualized
Trend (90d)
-7.9%
Annualized drift
90d Mean
C$0.26
Expected price
| Horizon | Expected | 68% Range (1σ) |
|---|---|---|
| 30 trading days | C$0.26 | C$0.14 – C$0.51 |
| 60 trading days | C$0.26 | C$0.10 – C$0.66 |
| 90 trading days | C$0.26 | C$0.08 – C$0.81 |
Methodology: Range is calculated using 30-day realized volatility via geometric Brownian motion (log-normal model). 68% band = ±1σ, 95% band = ±2σ. This is a statistical model, not a prediction. Past volatility does not guarantee future results. Not financial advice.
About Sandfire Resources America Inc
Sandfire Resources America Inc. engages in the acquisition, exploration, and development of resource properties in the United States. The company explores for copper, cobalt, and silver deposits. Its flagship property is the 100% owned Black Butte copper project located in central Montana, the United States. The company was formerly known as Tintina Resources Inc. and changed its name to Sandfire Resources America Inc. in January 2018. Sandfire Resources America Inc. was incorporated in 1998 and is headquartered in Vancouver, Canada. Sandfire Resources America Inc. operates as a subsidiary of Sandfire Resources Ltd.
Financials
- Revenue (TTM)
- $0
- EBITDA
- $-19.46M
- Profit Margin
- 0.00%
- ROE (TTM)
- -661.65%
- EPS (Diluted)
- -0.03
- Book Value
- -0.06
Classification
- Sector
- Materials
- Industry
- Metals & Mining
- Group
- Materials
Advertisement
7 stocks to buy and hold forever
Blue-chip dividend stocks for long-term wealth building.
Get the FREE ReportExplore More
Common Questions About SFR
Articles Featuring SFR.V
Latest articles and analysis covering SFR.V
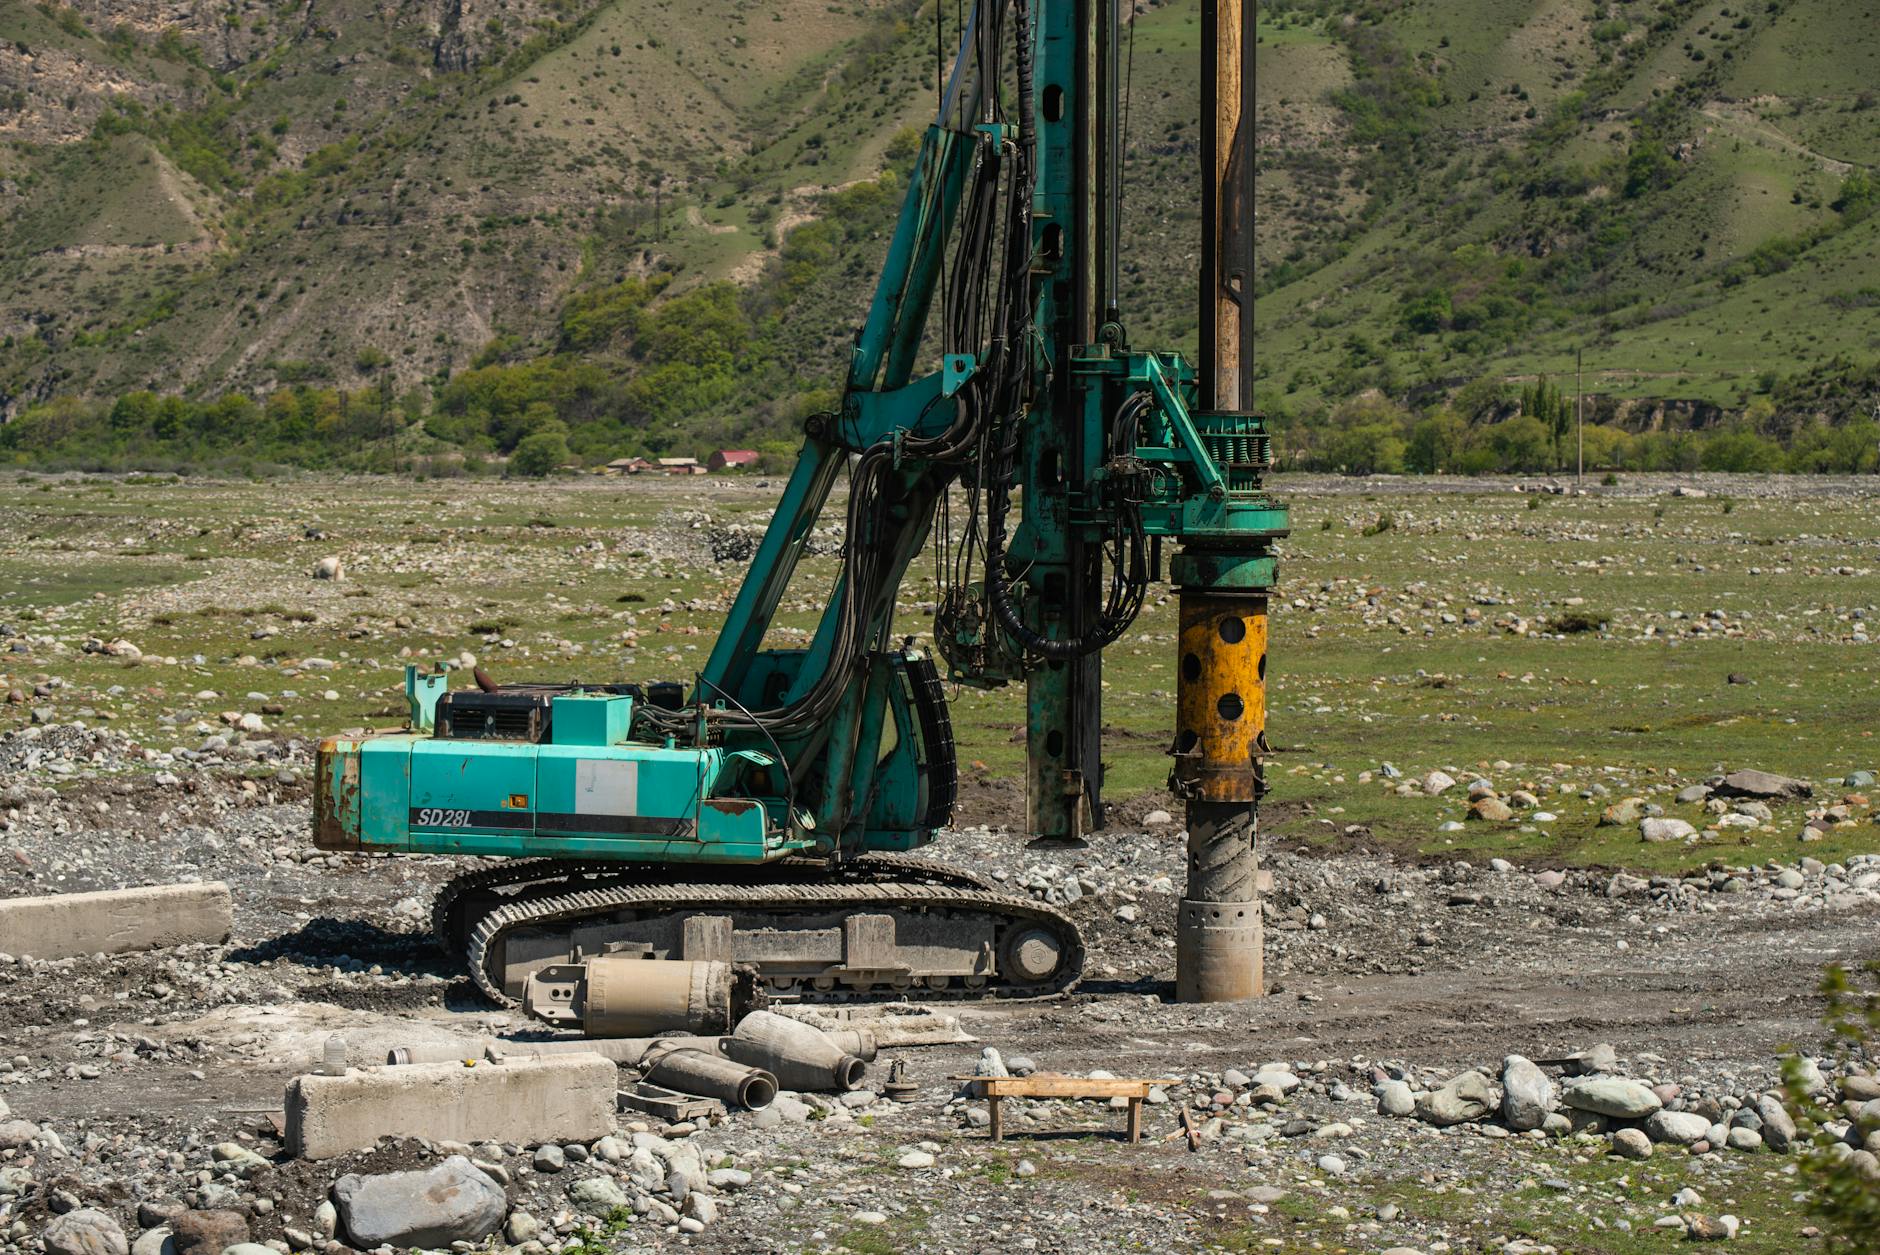
Why Sandfire Resources America Inc stock is plummeting today
Sandfire Resources America Inc's stock has plummeted today, raising alarms about its financial health and future prospects. Investors are urged to reassess their positions in light of this significant decline.
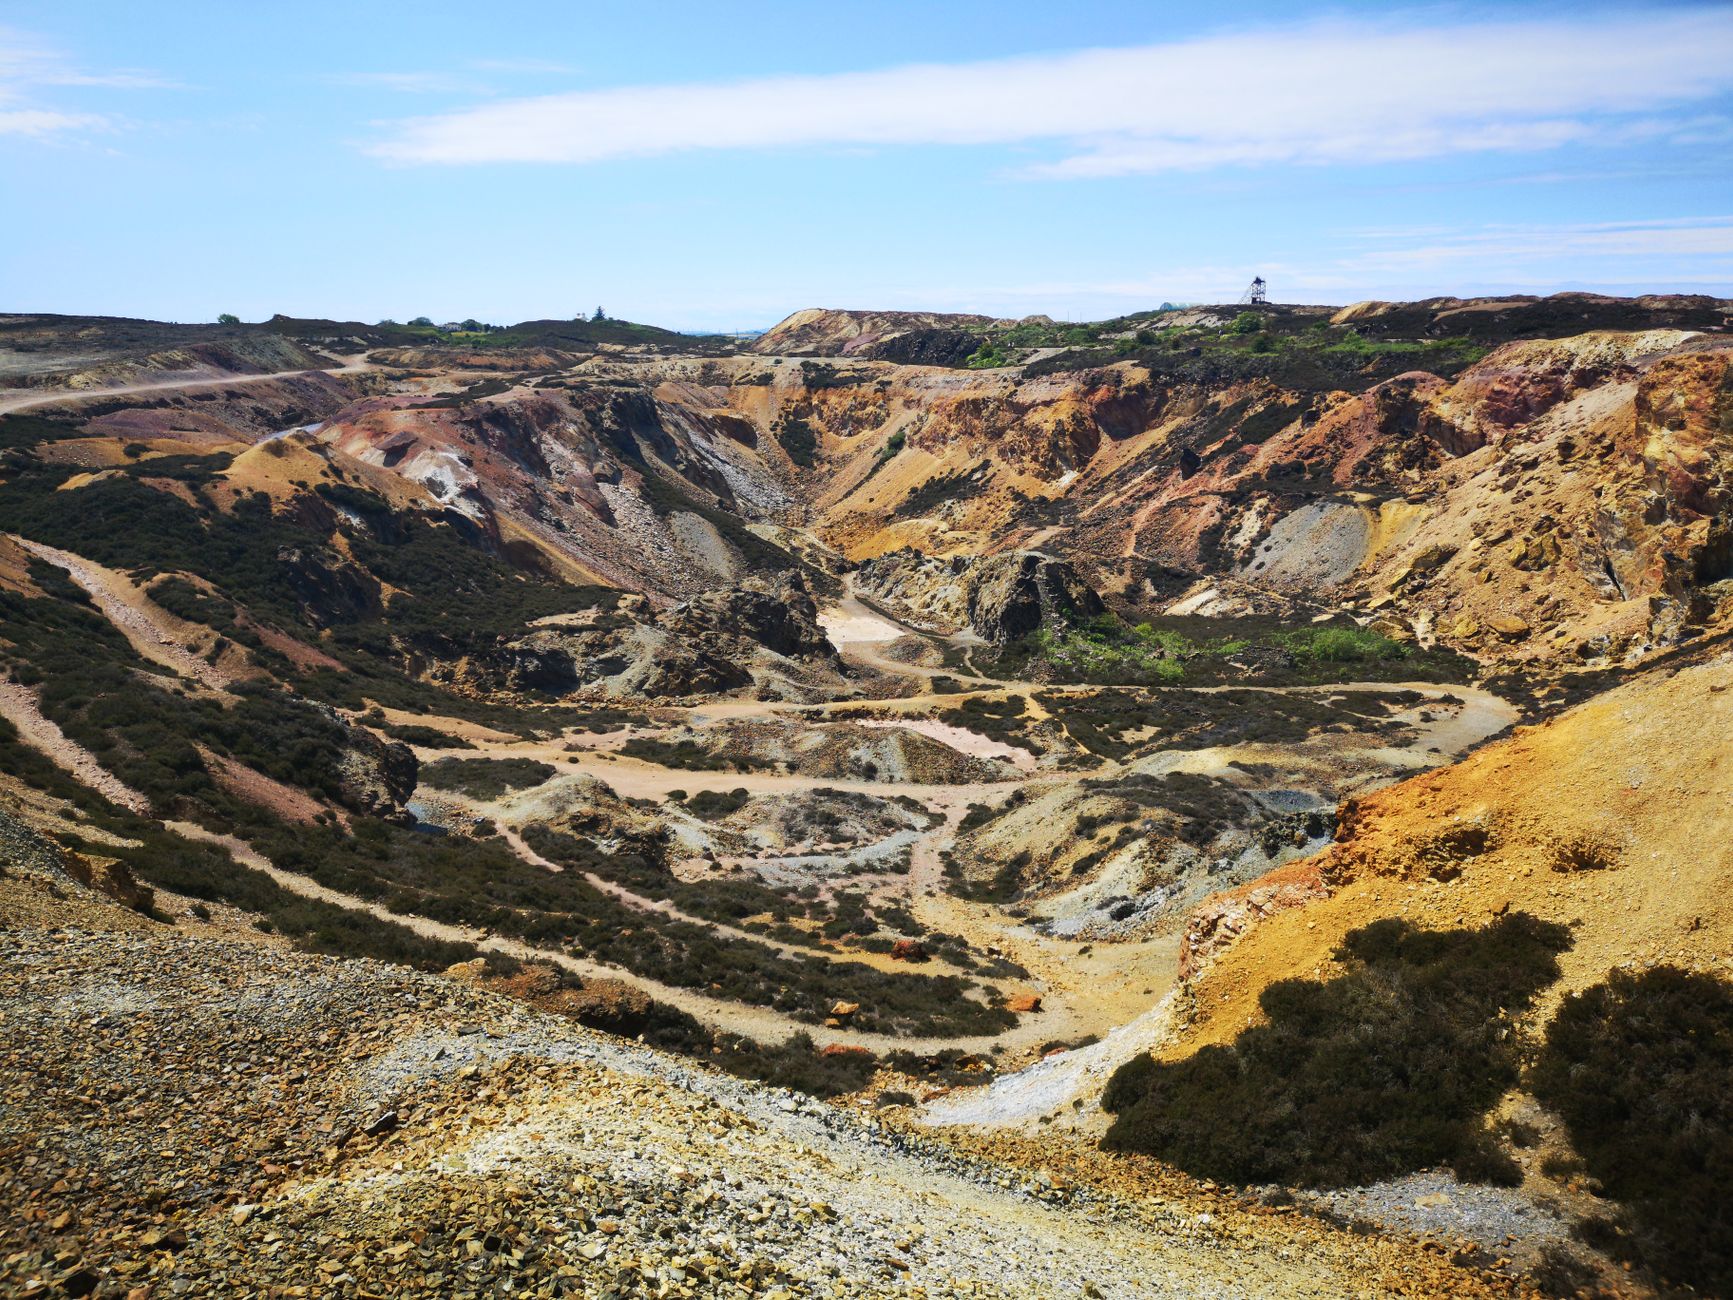
Why Sandfire Resources America Inc stock is skyrocketing today
Sandfire Resources America Inc (SFR.V) has skyrocketed by over 68% today, closing at CA$0.37. This dramatic rise has put the company in the spotlight, prompting investors to take a closer look at its potential future developments.
Why Sandfire Resources America Inc stock is skyrocketing today
Sandfire Resources America Inc is seeing a significant stock price increase today, with a 7.50% rise to CA$0.21, driven by investor optimism about its operational strategies and financial reporting changes.
Why Sandfire Resources America Inc stock is sliding today
Sandfire Resources America Inc's stock fell by 4.76% in the last trading session, closing at CA$0.20. This decline highlights investor caution amid a lack of recent positive developments.
Why Sandfire Resources America Inc stock is rising today
Sandfire Resources America Inc (SFR.V) saw a notable rise of 2.50% in its stock price during the last trading session, closing at CA$0.20. This uptick may reflect growing investor interest, particularly in light of the company's ongoing projects.
Canadian materials stocks under $250M market cap — May 18, 2026
Explore promising Canadian materials stocks under $250 million market cap, featuring Sandfire Resources and more.
Canadian materials stocks under $250M market cap — May 13, 2026
Explore Canadian materials stocks under CA$250M market cap, showcasing potential growth opportunities in the sector.
Canadian materials stocks under $250M market cap — May 12, 2026
Explore promising Canadian materials stocks under $250M market cap, including Lara Exploration and Maple Gold Mines.