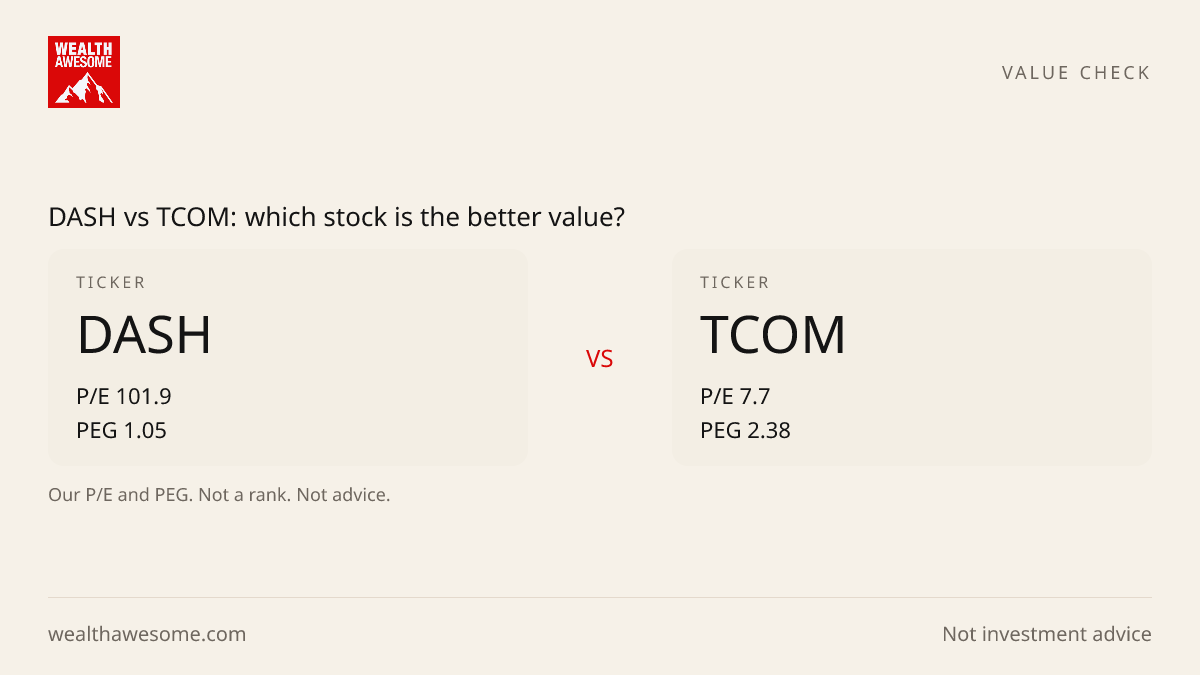
A comparison of DoorDash and Trip.com reveals a stark contrast in valuation metrics, raising questions about which stock offers better value.
In the consumer discretionary sector, DoorDash, Inc. (DASH) and Trip.com Group Ltd (TCOM) present two distinct investment opportunities. While both companies operate within the consumer services industry, their valuation metrics tell a different story. This analysis will delve into their respective price-to-earnings (P/E), price-to-earnings growth (PEG), and price-to-book (P/B) ratios to assess which stock might be considered a better value.
Investor takeaway: Trip.com Group Ltd appears cheaper on several valuation multiples compared to DoorDash, but lower valuations do not necessarily indicate a superior investment. Investors should consider other factors such as growth potential and market conditions.
Advertisement
Stocks in this list
Live snapshots — open any name for the full quote and Wealth Awesome price forecast.
DoorDash, Inc. Class A Common Stock
DASH.US
Consumer Discretionary
$191.24
$83.90B
1D
-1.23%
1W
+4.19%
Trip.com Group Ltd ADR
TCOM.US
Consumer Discretionary
$38.09
$24.09B
1D
-0.44%
1W
-2.58%
Advertisement
Valuation Comparison Summary
Trip.com Group Ltd offers a significantly lower P/E and P/B compared to DoorDash, indicating a cheaper valuation in the market.
Advertisement
Bull case
Trip.com’s lower P/E ratio of 7.7 suggests it may be undervalued based on its earnings. Plus, a higher return on equity (ROE) of 15.7% shows that the company is effectively managed and profitable, which could attract more investors looking for value.
Bear case
On the other hand, DoorDash's higher P/E of 101.9 reflects its growth potential in the food delivery market. However, this high valuation also comes with greater risk if the company doesn’t meet growth expectations. Investors should be cautious about potential volatility.
Market Capitalization and Analyst Sentiment
The market capitalization of DoorDash stands at US$83.9 billion, significantly larger than Trip.com, which has a market cap of US$24.1 billion. This disparity may reflect differing growth trajectories and market positions. Analyst consensus labels indicate a 'Buy' for DoorDash and a 'Strong Buy' for Trip.com, suggesting that analysts have a positive outlook on both companies, albeit with varying degrees of confidence in their future performance.
Best next step
Keep exploring this topic
If you want to go deeper, these are the most useful follow-up pages and tools for this topic.
Broker comparison
Best trading platforms in Canada
Compare $0-commission brokers before you act on a ticker story.
Safe cash
Best GIC rates in Canada
If the story makes you want to de-risk, compare guaranteed rates next.
HISA roundup
Best high-interest savings accounts
Keep dry powder in a no-fee savings account instead of chequing.
TFSA room
Check TFSA contribution room
Shelter the next contribution before you buy.
Advertisement

Wealth Awesome
Timely coverage of Canadian stocks, earnings, dividends, and market movers for DIY investors. Stories are checked against exchange data and public filings.
View Full Profile →✅ Reviewed by Certified Financial Professionals
This content has been reviewed by CFA® charterholders and Certified Financial Planners (CFP®) with over a decade of experience in Canadian financial markets. All information is fact-checked against official Canadian sources and regulations.
Why these credentials matter: CFA® charterholders complete 900+ hours of rigorous study in investment analysis and ethics. CFP® professionals are held to the highest standards of financial planning competency and fiduciary duty in Canada.
⚠️ Professional Disclaimer
This content is for educational purposes only and should not be considered personalized financial advice. While our team brings professional expertise, individual circumstances vary. For personalized guidance, consult with a qualified financial advisor, tax professional, or mortgage specialist.