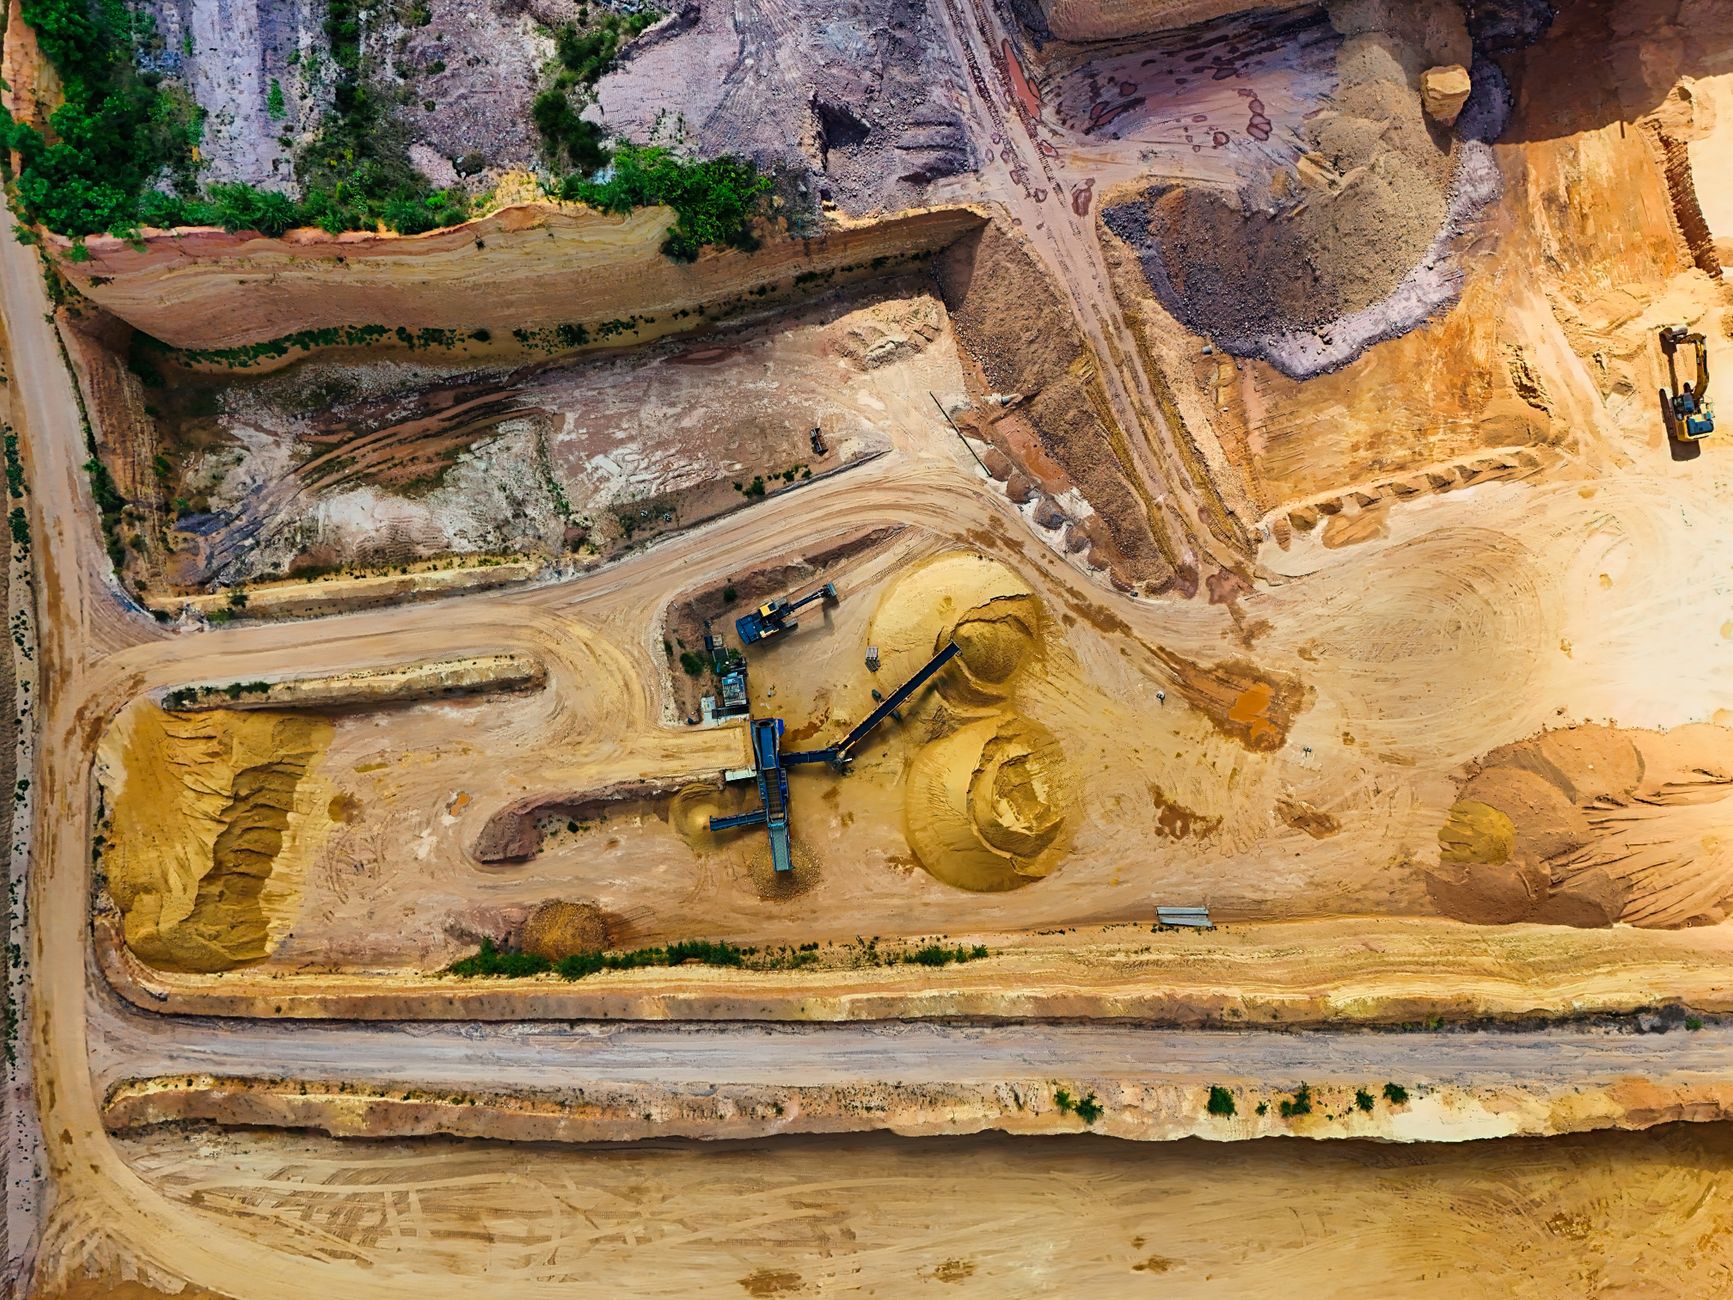
Explore the latest movements in the Canadian materials sector with a focus on smaller market cap stocks.
The Canadian materials sector is home to a variety of companies with market capitalizations under $250 million. Here’s a look at the latest performance of these stocks as of October 7, 2026:
Advertisement
Stocks in this list
Live snapshots — open any name for the full quote and Wealth Awesome price forecast.
1911 Gold Corp
AUMB.V
Materials
$0.690
$246.93M
1D
-2.82%
1W
-9.21%
Foraco International SA
FAR.TO
Materials
$2.500
$244.63M
1D
-2.34%
1W
-4.58%
Amarc Resources Ltd.
AHR.V
Materials
$0.995
$240.66M
1D
-0.50%
1W
+2.58%
Surge Battery Metals Inc
NILI.V
Materials
$0.740
$238.93M
1D
+1.37%
1W
-1.33%
Lara Exploration Ltd.
LRA.V
Materials
$4.010
$238.07M
1D
+6.93%
1W
+0.25%
Platinum Group Metals Ltd
PTM.TO
Materials
$1.810
$231.47M
1D
-1.09%
1W
-1.09%
Pulsar Helium Inc.
PLSR.V
Materials
$1.080
$231.43M
1D
-6.90%
1W
-12.20%
Revival Gold Inc
RVG.V
Materials
$0.710
$231.32M
1D
-1.39%
1W
-12.35%
Advertisement
| Company Name | Ticker | Price (CA$) | Market Cap (CA$) | 1D Change | 1W Change |
|---|---|---|---|---|---|
| 1911 Gold Corp | AUMB.V | 0.690 | 246.9M | -2.82% | -9.21% |
| Foraco International SA | FAR.TO | 2.500 | 244.6M | -2.34% | -4.58% |
| Amarc Resources Ltd. | AHR.V | 0.995 | 240.7M | -0.50% | +2.58% |
| Surge Battery Metals Inc | NILI.V | 0.740 | 238.9M | +1.37% | -1.33% |
| Lara Exploration Ltd. | LRA.V | 4.010 | 238.1M | +6.93% | +0.25% |
| Platinum Group Metals Ltd | PTM.TO | 1.810 | 231.5M | -1.09% | -1.09% |
| Pulsar Helium Inc. | PLSR.V | 1.080 | 231.4M | -6.90% | -12.20% |
| Revival Gold Inc | RVG.V | 0.710 | 231.3M | -1.39% | -12.35% |
| Northcliff Resources Ltd | NCF.TO | 0.350 | 228.8M | +1.45% | +2.94% |
| CVW Sustainable Royalties Inc. | CVW.V | 0.790 | 225.5M | +1.28% | +6.76% |
| PPX Mining Corp | PPX.V | 0.250 | 225.0M | -1.96% | -5.66% |
| Maple Gold Mines Ltd | MGM.V | 2.980 | 221.4M | +2.05% | -2.30% |
Investor takeaway: Investors looking at small-cap materials stocks should consider the volatility and potential growth opportunities within this sector. Each company comes with its own set of risks and rewards.
Top Small-Cap Materials Stocks
The average market cap of the listed companies is approximately CA$233.4 million, showcasing a diverse range of investment opportunities within the materials sector.
Bull case
AUMB.V has shown resilience despite recent downturns. LRA.V's recent gains could indicate positive market sentiment. AHR.V's slight uptick over the week may suggest growing investor interest.
Bear case
FAR.TO and PLSR.V have seen notable declines over the past week, signaling potential challenges in their operations or how the market views them. Additionally, CVW.V and PPX.V's recent fluctuations may reflect broader sector volatility.
1911 Gold Corp (AUMB.V)
Advertisement
1911 Gold Corp focuses on gold exploration in North America. With a market cap of CA$246.9 million, the company has faced recent challenges, reflected in a 9.21% decline over the past week. Investors may want to keep an eye on its exploration results and market conditions that could impact gold prices.
Foraco International SA (FAR.TO)
Foraco International is a leading global drilling services provider with a market cap of CA$244.6 million. The company's recent performance shows a slight decline of 4.58% over the past week. As a service provider in the materials sector, its success is closely tied to the demand for mining and exploration activities.
Lara Exploration Ltd. (LRA.V)
Lara Exploration Ltd. specializes in mineral exploration and has a market cap of CA$238.1 million. The company has seen a 6.93% increase in its stock price today, indicating potential positive developments in its exploration projects. Investors should consider the implications of its recent performance on future growth.
Best next step
Keep exploring this topic
If you want to go deeper, these are the most useful follow-up pages and tools for this topic.
Broker comparison
Best trading platforms in Canada
Compare $0-commission brokers before you act on a ticker story.
Safe cash
Best GIC rates in Canada
If the story makes you want to de-risk, compare guaranteed rates next.
HISA roundup
Best high-interest savings accounts
Keep dry powder in a no-fee savings account instead of chequing.
TFSA room
Check TFSA contribution room
Shelter the next contribution before you buy.
Advertisement

Wealth Awesome
Timely coverage of Canadian stocks, earnings, dividends, and market movers for DIY investors. Stories are checked against exchange data and public filings.
View Full Profile →✅ Reviewed by Certified Financial Professionals
This content has been reviewed by CFA® charterholders and Certified Financial Planners (CFP®) with over a decade of experience in Canadian financial markets. All information is fact-checked against official Canadian sources and regulations.
Why these credentials matter: CFA® charterholders complete 900+ hours of rigorous study in investment analysis and ethics. CFP® professionals are held to the highest standards of financial planning competency and fiduciary duty in Canada.
⚠️ Professional Disclaimer
This content is for educational purposes only and should not be considered personalized financial advice. While our team brings professional expertise, individual circumstances vary. For personalized guidance, consult with a qualified financial advisor, tax professional, or mortgage specialist.