Yorbeau Resources Inc. (YRB.TO) has shown stable performance this week, but it remains under pressure year-to-date.
The company has kept its stock price at C$0.05 this week, with no significant fluctuations. Despite the lack of major news, Yorbeau is actively pursuing exploration initiatives that could impact its future performance.
Advertisement

Get up to $2,000 cash back
Open and fund a new Qtrade account with promo code SPRING26. Offer ends July 31, 2026.
Yorbeau Resources Inc
YRB.TO
YRB.TO
Yorbeau Resources Inc
 WealthAwesome
Market cap
$23.77M
P/E
0.0x
52W high
$0.08
52W low
$0.04
1W change
+0.00%
Beta
1.36
Wealth Awesome Price Forecast
WA ModelStatistical 90-day price range based on YRB's historical volatility
30-Day Vol
101.8%
Annualized
90-Day Vol
98.0%
Annualized
Trend (90d)
-50.0%
Annualized drift
90d Mean
C$0.04
Expected price
| Horizon | Expected | 68% Range (1σ) |
|---|---|---|
| 30 trading days | C$0.05 | C$0.03 – C$0.07 |
| 60 trading days | C$0.04 | C$0.03 – C$0.07 |
| 90 trading days | C$0.04 | C$0.02 – C$0.08 |
Methodology: Range is calculated using 30-day realized volatility via geometric Brownian motion (log-normal model). 68% band = ±1σ, 95% band = ±2σ. This is a statistical model, not a prediction. Past volatility does not guarantee future results. Not financial advice.
Investor takeaway: Investors should stay cautious as Yorbeau explores opportunities while navigating a challenging market. The recent exploration programs could offer potential upside, but current performance indicators suggest a wait-and-see approach.
Yorbeau Resources Inc. Stock Stays Flat at C$0.05
With a market cap of about C$23.77 million and a P/E ratio of 0, the stock reflects a cautious investment environment, despite a profit margin of 123.9%.
Bull case
New exploration programs on the Beschefer, Selbaie West, and Allard properties could lead to discoveries that enhance the company's valuation and improve market sentiment.
Bear case
Yorbeau's stock has dropped 23.08% year-to-date, and the overall lack of significant news may lead to continued stagnation in share price. Technical indicators show that the stock is trading below its moving averages, suggesting further downside risk.
Current Price Action
Yorbeau Resources Inc. (YRB.TO) closed at C$0.05, reflecting stable performance with no percentage change over the last trading day. Over the past week, the stock has remained flat, with a month-to-date decline of 16.67% and a year-to-date drop of 23.08%. This stability in a broader market context indicates cautious investor sentiment.
Recent Company News
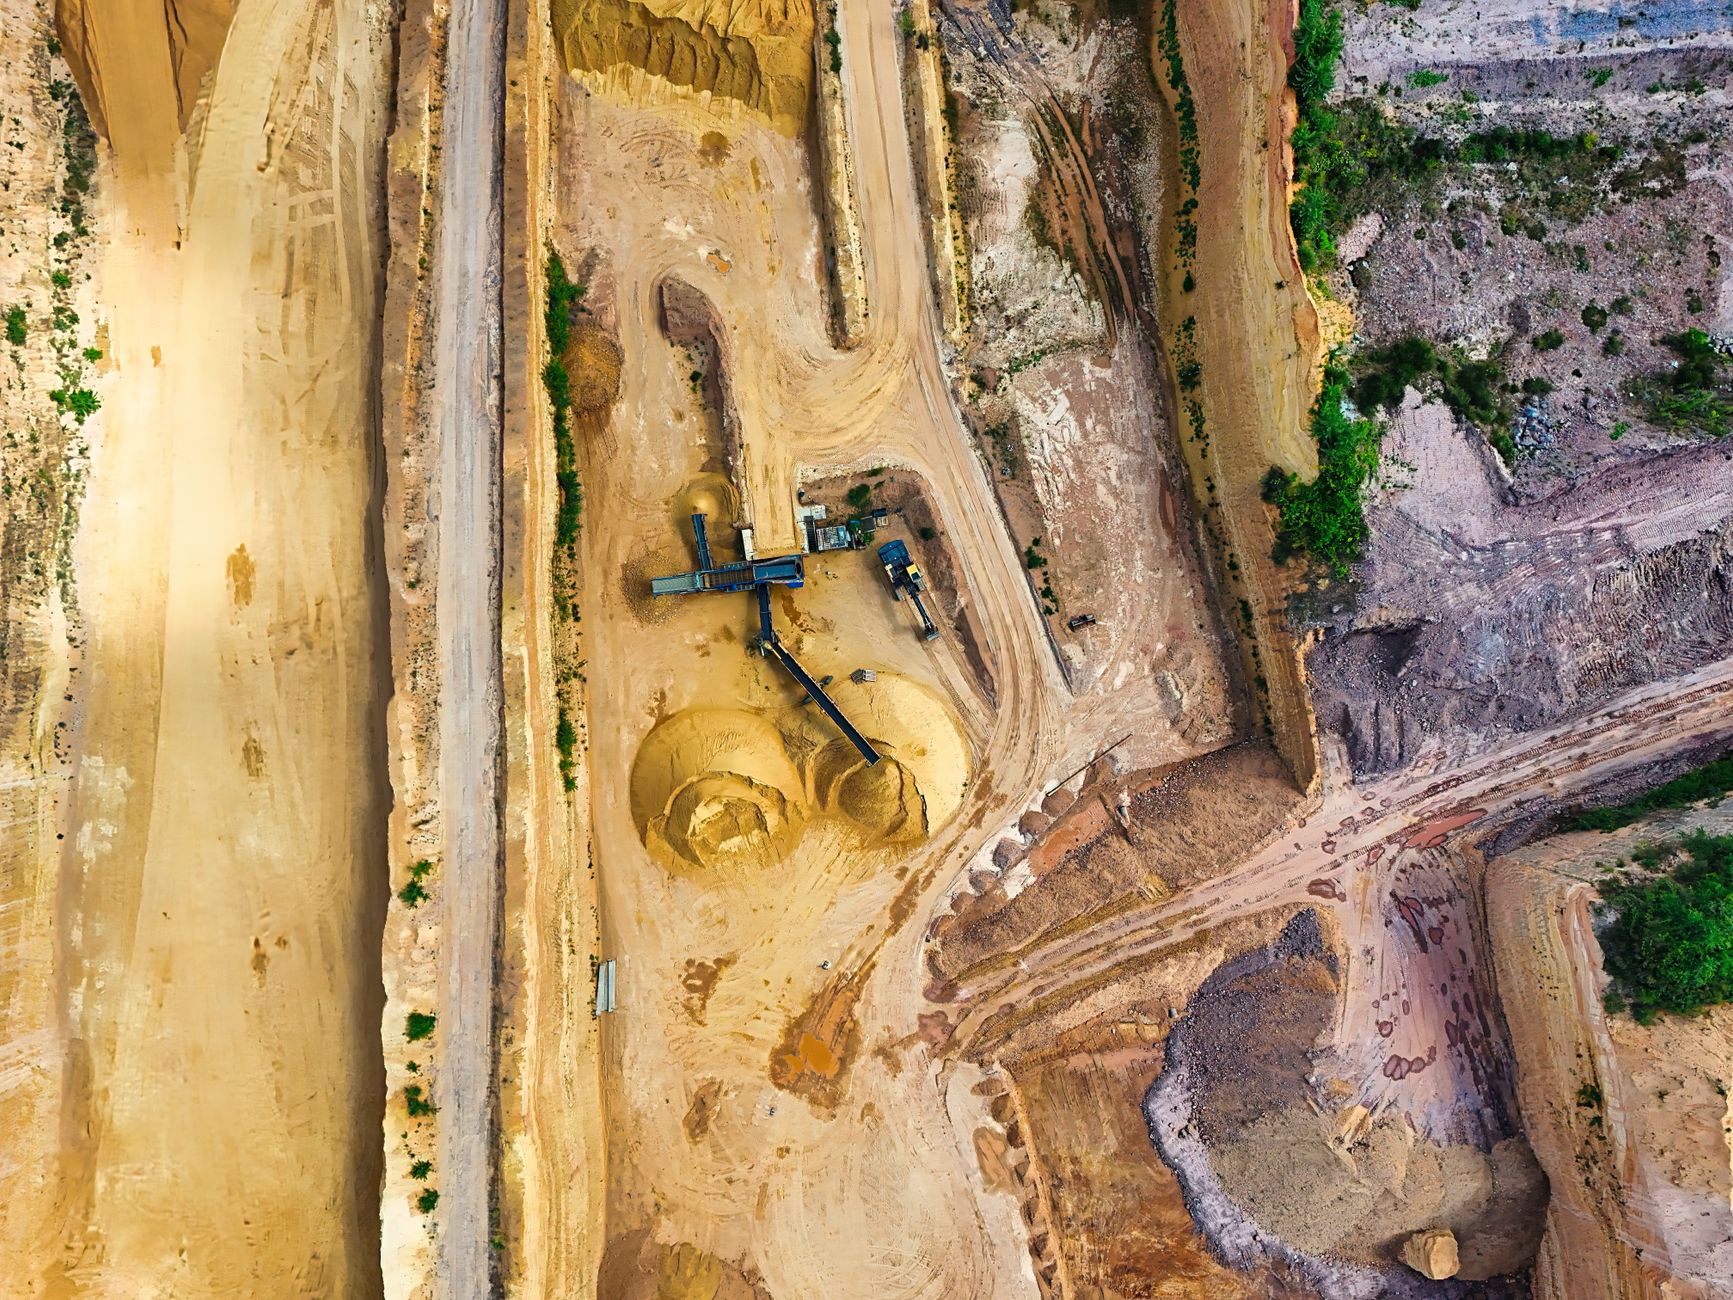
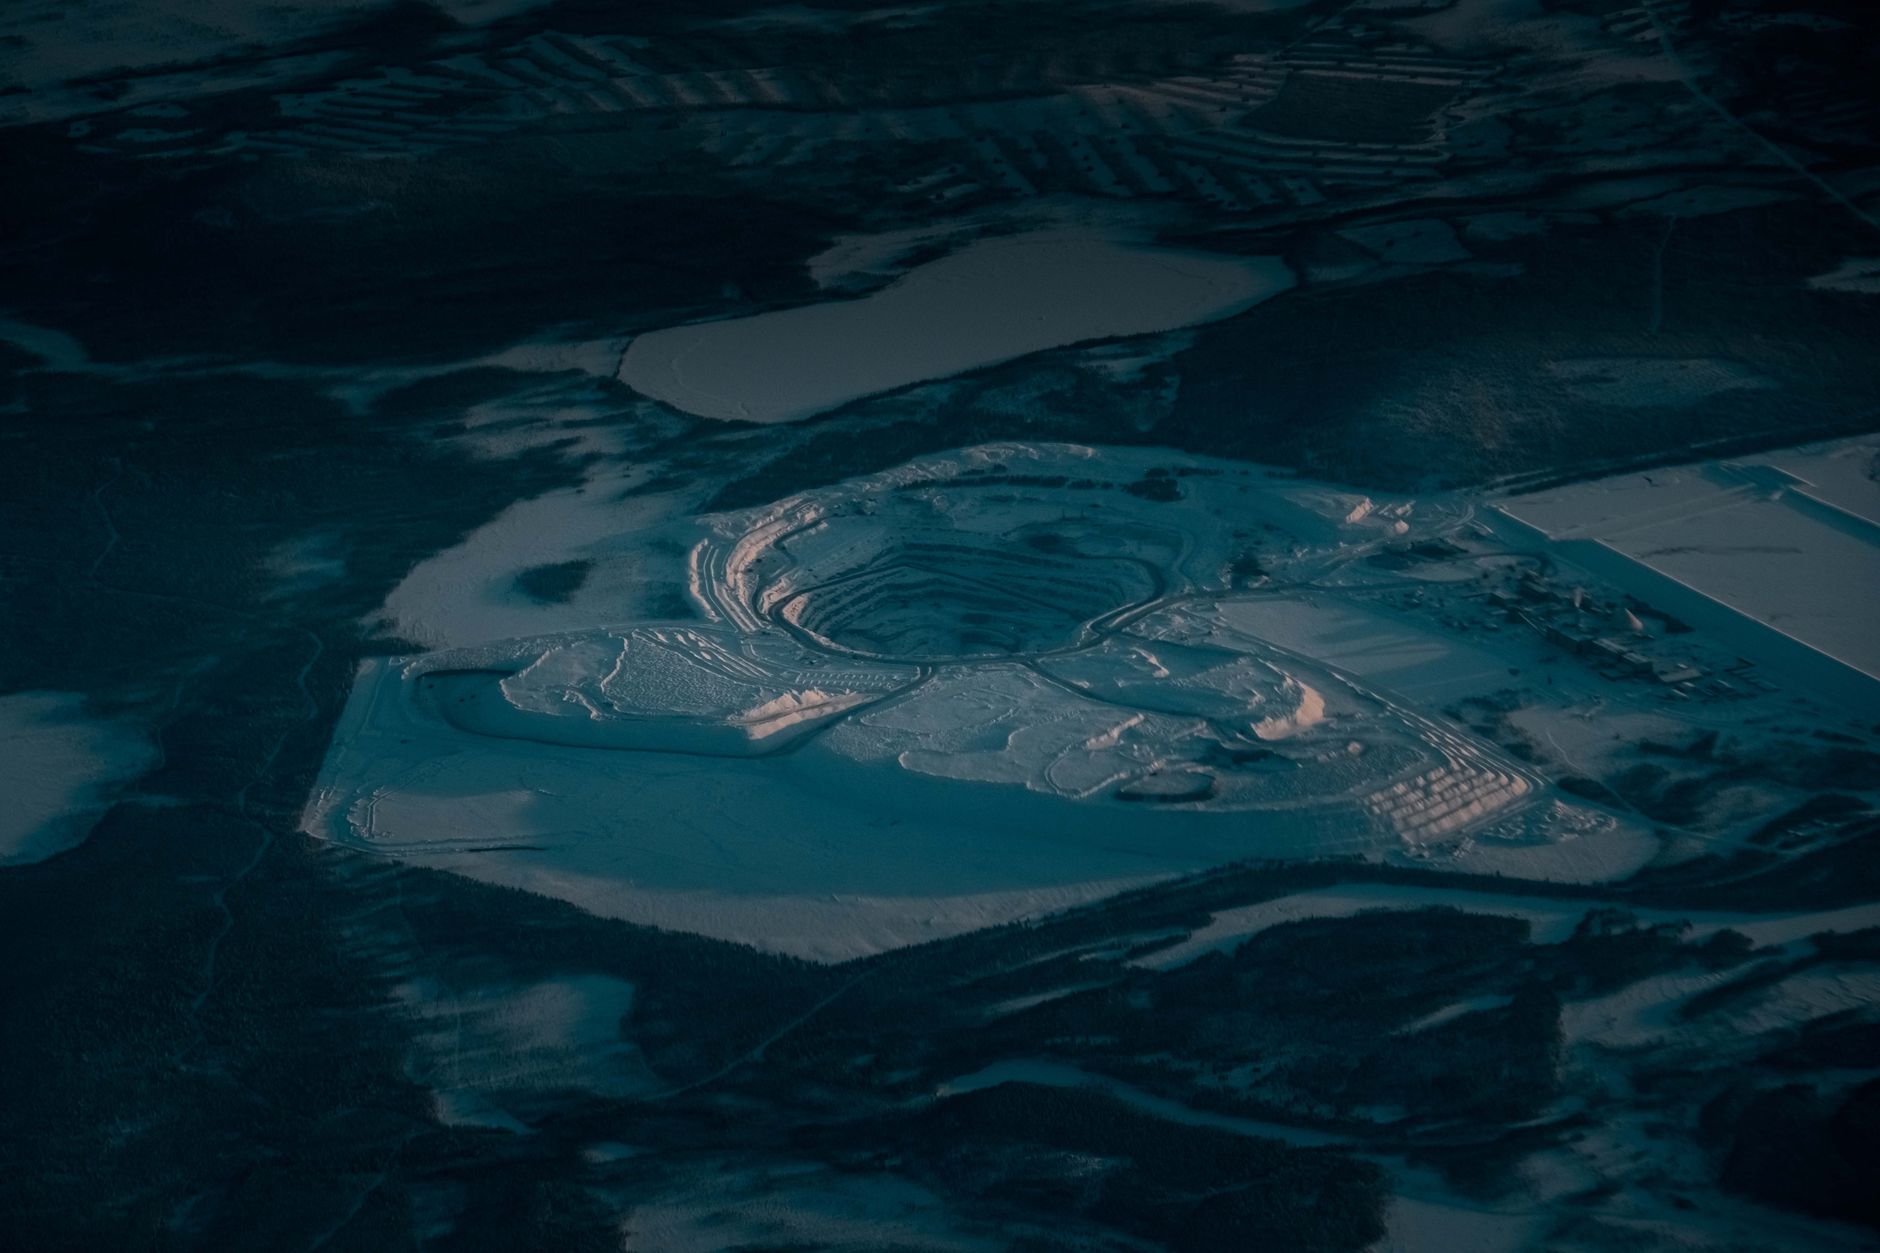
While there is no significant news this week, Yorbeau Resources has started an exploration program on its Beschefer, Selbaie West, and Allard properties. This drilling program aims to cover about 5,645 meters across these properties, located near the former Selbaie mine. The results of these exploration efforts could serve as future catalysts for the stock, although immediate impacts are not yet visible.
Technical Picture
Yorbeau's stock is currently trading below both its 50-day and 200-day moving averages of C$0.06, indicating a bearish technical outlook. The stock's 52-week range spans from C$0.04 to C$0.08, with the current price at approximately 25% of this range. The stock's beta of 1.36 suggests higher volatility compared to the overall market, which may lead to larger price swings.
Volume Activity
The trading volume for Yorbeau Resources has been notable, with the latest volume recorded at 504,000 shares, exceeding the 20-day average volume of 397,902 shares by 1.27 times. This increase may indicate heightened interest or activity among investors, though it remains to be seen how this will affect price movement.
Advertisement