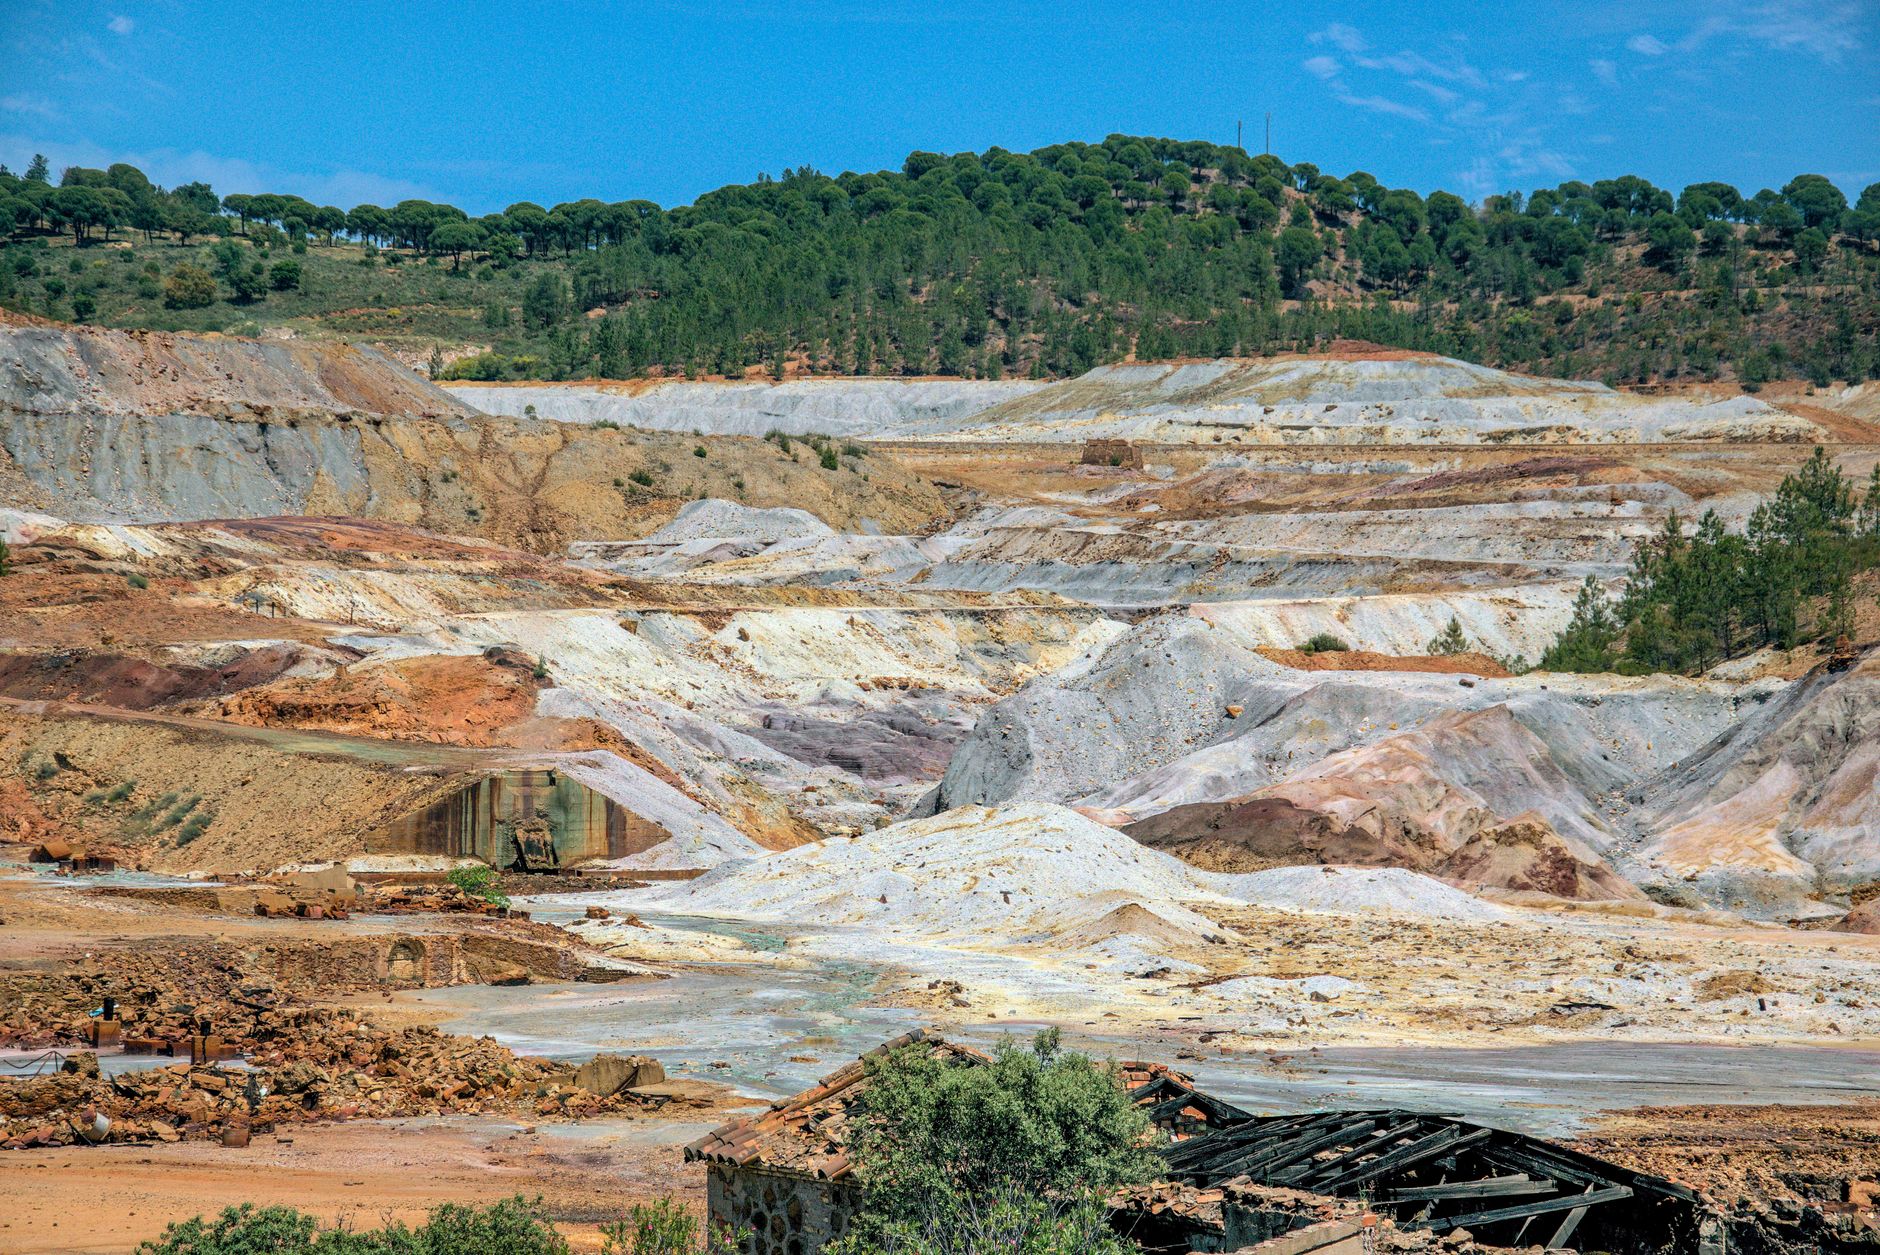
BCM Resources Corp continues to navigate a challenging market landscape as it embarks on new exploration initiatives.
This week, BCM Resources Corp (B.V) has seen its stock price fluctuate amid new developments regarding its exploration projects. The company is focusing on its Thompson Knolls project, which has recently garnered attention following the initiation of a drill campaign. Let's delve into the latest price action and company news.
Investor takeaway: Investors should be aware of BCM Resources Corp's ongoing exploration efforts and recent financing activities, which may impact future performance despite current volatility.
Advertisement

Get up to $2,000 cash back
Open and fund a new Qtrade account with promo code SPRING26. Offer ends July 31, 2026.
BCM Resources Corp
B.V
B.V
BCM Resources Corp
 WealthAwesome
Market cap
$35.25M
P/E
0.0x
52W high
$0.33
52W low
$0.07
1W change
-6.25%
Beta
1.86
Wealth Awesome Price Forecast
WA ModelStatistical 90-day price range based on B's historical volatility
30-Day Vol
182.9%
Annualized
90-Day Vol
137.9%
Annualized
Trend (90d)
-50.0%
Annualized drift
90d Mean
C$0.13
Expected price
| Horizon | Expected | 68% Range (1σ) |
|---|---|---|
| 30 trading days | C$0.14 | C$0.08 – C$0.27 |
| 60 trading days | C$0.13 | C$0.05 – C$0.33 |
| 90 trading days | C$0.13 | C$0.04 – C$0.37 |
Methodology: Range is calculated using 30-day realized volatility via geometric Brownian motion (log-normal model). 68% band = ±1σ, 95% band = ±2σ. This is a statistical model, not a prediction. Past volatility does not guarantee future results. Not financial advice.
BCM Resources Corp Closes at C$0.15, Down 6.25% This Week
The stock has experienced a notable decline of 38.78% over the past month, reflecting investor caution amid ongoing market challenges.
Bull case
The drill campaign at Thompson Knolls has the potential to uncover significant discoveries, which could enhance the company's valuation and attract more investor interest.
Bear case
The stock's significant volatility and decline over the past month raise concerns about the company's operational efficiency and overall market sentiment.
Price Action Overview
BCM Resources Corp's stock closed at C$0.15, marking a 3.45% increase on the day but a 6.25% decrease over the week. Year-to-date, the stock remains unchanged, while it has seen a significant drop of 38.78% over the past month.
Recent Company Developments
This week, BCM Resources Corp announced the commencement of a drill campaign at its 100% controlled Thompson Knolls project in Utah. This initiative follows the successful completion of a non-brokered private placement, which raised approximately $7.18 million to fund exploration activities. The company has engaged National EWP and TonaTec Exploration to carry out the drilling, aimed at further assessing the project's potential.
Technical Picture
Analyzing BCM Resources Corp's technical indicators, the stock is currently trading below both its 50-day moving average (C$0.24) and its 200-day moving average (C$0.19), indicating a bearish trend. The stock has a beta of 1.86, suggesting higher volatility compared to the market. Over the past 52 weeks, the stock has ranged from C$0.07 to C$0.33, currently sitting at 31% of its 52-week range. The latest trading volume of 25,434 shares is significantly lower than the 20-day average volume of 144,591 shares, reflecting reduced investor interest.
Advertisement