
Talon Metals Stock Surged 900% — Here’s What Actually Drove the Move
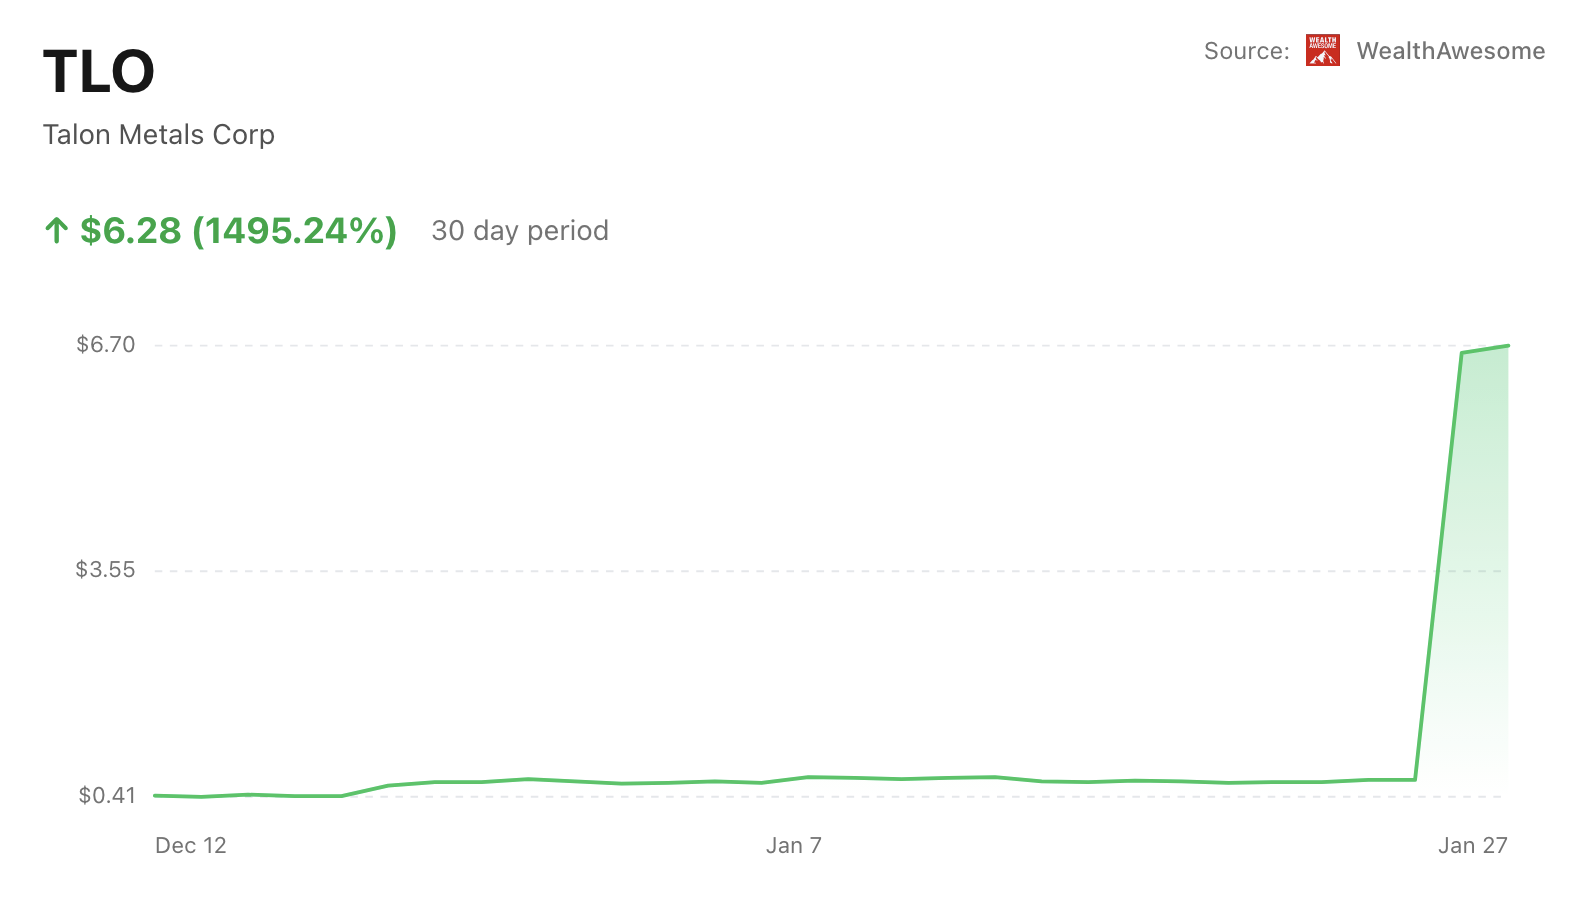
Shares of Talon Metals Corp. delivered one of the most eye-catching moves on the TSX today, posting a gain of more than 900% after the stock began trading on a consolidated share basis.
Why This Matters Today
Moves of this magnitude immediately grab attention, particularly in thinly traded resource stocks. In Talon’s case, the headline surge reflects a structural reset rather than a sudden shift in how the market views the company’s underlying business.
Advertisement
Talon Metals Corp
TLO.TO
TLO.TO
Talon Metals Corp
 WealthAwesome
Market cap
$1.51B
P/E
0.0x
52W high
$11.23
52W low
$3.65
1W change
-3.11%
Beta
1.67
Analyst Price Targets
Based on analyst covering TLO · as of Sep 21, 2026
Wall Street analysts forecast TLO stock price to rise 7.9% over the next 12 months.
Consensus
Moderately BullishBased on avg. target vs last close (formal rating unavailable for Canadian listings)
Avg. Target
C$10.08
+7.9% Upside
Previously C$9.08 on Sep 17, 2026
Current Price
C$9.34
Last close
Targets are snapshotted when they change. Unchanged figures keep their original date. Not financial advice.
Wealth Awesome Price Forecast
WA ModelStatistical 90-day price range based on TLO's historical volatility
30-Day Vol
109.3%
Annualized
90-Day Vol
91.3%
Annualized
Trend (90d)
+50.0%
Annualized drift
90d Mean
C$11.17
Expected price
| Horizon | Expected | 68% Range (1σ) |
|---|---|---|
| 30 trading days | C$9.91 | C$6.80 – C$14.45 |
| 60 trading days | C$10.52 | C$6.17 – C$17.94 |
| 90 trading days | C$11.17 | C$5.81 – C$21.46 |
Methodology: Range is calculated using 30-day realized volatility via geometric Brownian motion (log-normal model). 68% band = ±1σ, 95% band = ±2σ. This is a statistical model, not a prediction. Past volatility does not guarantee future results. Not financial advice.
Advertisement
What Just Happened
- Talon Metals Corp. completed a 1-for-10 share consolidation that took effect for trading today.
- The stock resumed trading on the TSX under the same ticker, TLO, on a post-consolidation basis.
- The quoted share price moved from roughly $0.66 to about $6.60, mechanically reflecting the reduced share count.
- The apparent gain stems from the consolidation itself, not from new operational or financial disclosures.
Why the Market Is Reacting
The move is almost entirely mechanical. A reverse split reduces the number of shares outstanding while increasing the per-share price proportionally, leaving the company’s overall market capitalization largely unchanged. In Talon’s case, outstanding shares dropped from roughly 1.5 billion to about 150 million.
What does change is how the stock trades and how it screens. A higher nominal share price can alter liquidity patterns, affect inclusion in momentum and percentage-gainer lists, and remove the stock from sub-dollar filters used by some investors and platforms.
That dynamic helps explain why Talon Metals Corp. surged to the top of TSX gainer screens today, even though the company’s valuation did not reset in the same way.
Advertisement
The Key Number
1-for-10 — the share consolidation ratio that reduced Talon’s outstanding share count by roughly 90% overnight.
What Happens Next
Post-consolidation trading often brings short-term volatility as investors recalibrate position sizes, liquidity expectations, and price anchors. Some selling pressure is common as holders adjust to the new structure, while others wait for volume and pricing to stabilize.
Whether the higher share price leads to sustained interest will depend less on the consolidation itself and more on follow-through—particularly any updates tied to Talon’s nickel assets or financing activity.
Bottom Line
Today’s triple-digit percentage surge in Talon Metals Corp. is the result of a completed reverse split, not a sudden reassessment of fundamentals. The real significance is that the stock is now trading in a different price regime, which will shape liquidity, volatility, and investor behavior from here.
Best next step
Keep exploring this topic
If you want to go deeper, these are the most useful follow-up pages and tools for this topic.
Broker comparison
Best trading platforms in Canada
Compare $0-commission brokers before you act on a ticker story.
Safe cash
Best GIC rates in Canada
If the story makes you want to de-risk, compare guaranteed rates next.
HISA roundup
Best high-interest savings accounts
Keep dry powder in a no-fee savings account instead of chequing.
TFSA room
Check TFSA contribution room
Shelter the next contribution before you buy.
Advertisement

Qayyum Rajan, CFA
Qayyum is the CEO of Wealth Awesome, a leading Canadian personal finance publication. As a CFA charterholder with extensive experience in fintech, data science, and quantitative finance, he brings a unique analytical perspective to investing and wealth management.
View Full Profile →✅ Reviewed by Certified Financial Professionals
This content has been reviewed by CFA® charterholders and Certified Financial Planners (CFP®) with over a decade of experience in Canadian financial markets. All information is fact-checked against official Canadian sources and regulations.
Why these credentials matter: CFA® charterholders complete 900+ hours of rigorous study in investment analysis and ethics. CFP® professionals are held to the highest standards of financial planning competency and fiduciary duty in Canada.
⚠️ Professional Disclaimer
This content is for educational purposes only and should not be considered personalized financial advice. While our team brings professional expertise, individual circumstances vary. For personalized guidance, consult with a qualified financial advisor, tax professional, or mortgage specialist.