Viva Gold Corp (VAU : TSX-V)
Common Stock
$0.12
CAD
+0.01 (9.09%)
Last updated: 2026-06-30
VAU
Viva Gold Corp
Performance
1 Day
+9.09%
1 Week
-4.00%
1 Month
-17.24%
YTD
-38.46%
Key Statistics
Market Cap
$18.92M
52W High
$0.21
52W Low
$0.08
P/E Ratio
-
50 Day MA
$0.13
200 Day MA
$0.16
Beta
2.51
Dividend Yield
-
Technical Indicators
Price vs 50-Day SMA
Price vs 200-Day SMA
Recent Price History
| Date | Open | High | Low | Close | Adj Close | Volume |
|---|---|---|---|---|---|---|
| 6/30/2026 | $0.11 | $0.12 | $0.10 | $0.12 | $0.12 | 181,500 |
| 6/29/2026 | $0.11 | $0.12 | $0.11 | $0.11 | $0.11 | 84,412 |
| 6/26/2026 | $0.13 | $0.13 | $0.10 | $0.12 | $0.12 | 181,748 |
| 6/25/2026 | $0.12 | $0.12 | $0.12 | $0.12 | $0.12 | 32,500 |
| 6/24/2026 | $0.12 | $0.13 | $0.12 | $0.13 | $0.13 | 40,500 |
| 6/23/2026 | $0.12 | $0.13 | $0.12 | $0.13 | $0.13 | 34,893 |
| 6/22/2026 | $0.12 | $0.12 | $0.12 | $0.12 | $0.12 | 5,000 |
| 6/19/2026 | $0.12 | $0.12 | $0.12 | $0.12 | $0.12 | 10,200 |
| 6/18/2026 | $0.13 | $0.13 | $0.13 | $0.13 | $0.13 | 7,500 |
| 6/17/2026 | $0.13 | $0.13 | $0.13 | $0.13 | $0.13 | 72,000 |
Wealth Awesome Price Forecast
WA ModelStatistical 90-day price range based on VAU's historical volatility
30-Day Vol
78.8%
Annualized
90-Day Vol
83.0%
Annualized
Trend (90d)
-50.0%
Annualized drift
90d Mean
C$0.10
Expected price
| Horizon | Expected | 68% Range (1σ) |
|---|---|---|
| 30 trading days | C$0.11 | C$0.09 – C$0.15 |
| 60 trading days | C$0.11 | C$0.07 – C$0.16 |
| 90 trading days | C$0.10 | C$0.06 – C$0.16 |
Methodology: Range is calculated using 30-day realized volatility via geometric Brownian motion (log-normal model). 68% band = ±1σ, 95% band = ±2σ. This is a statistical model, not a prediction. Past volatility does not guarantee future results. Not financial advice.
About Viva Gold Corp
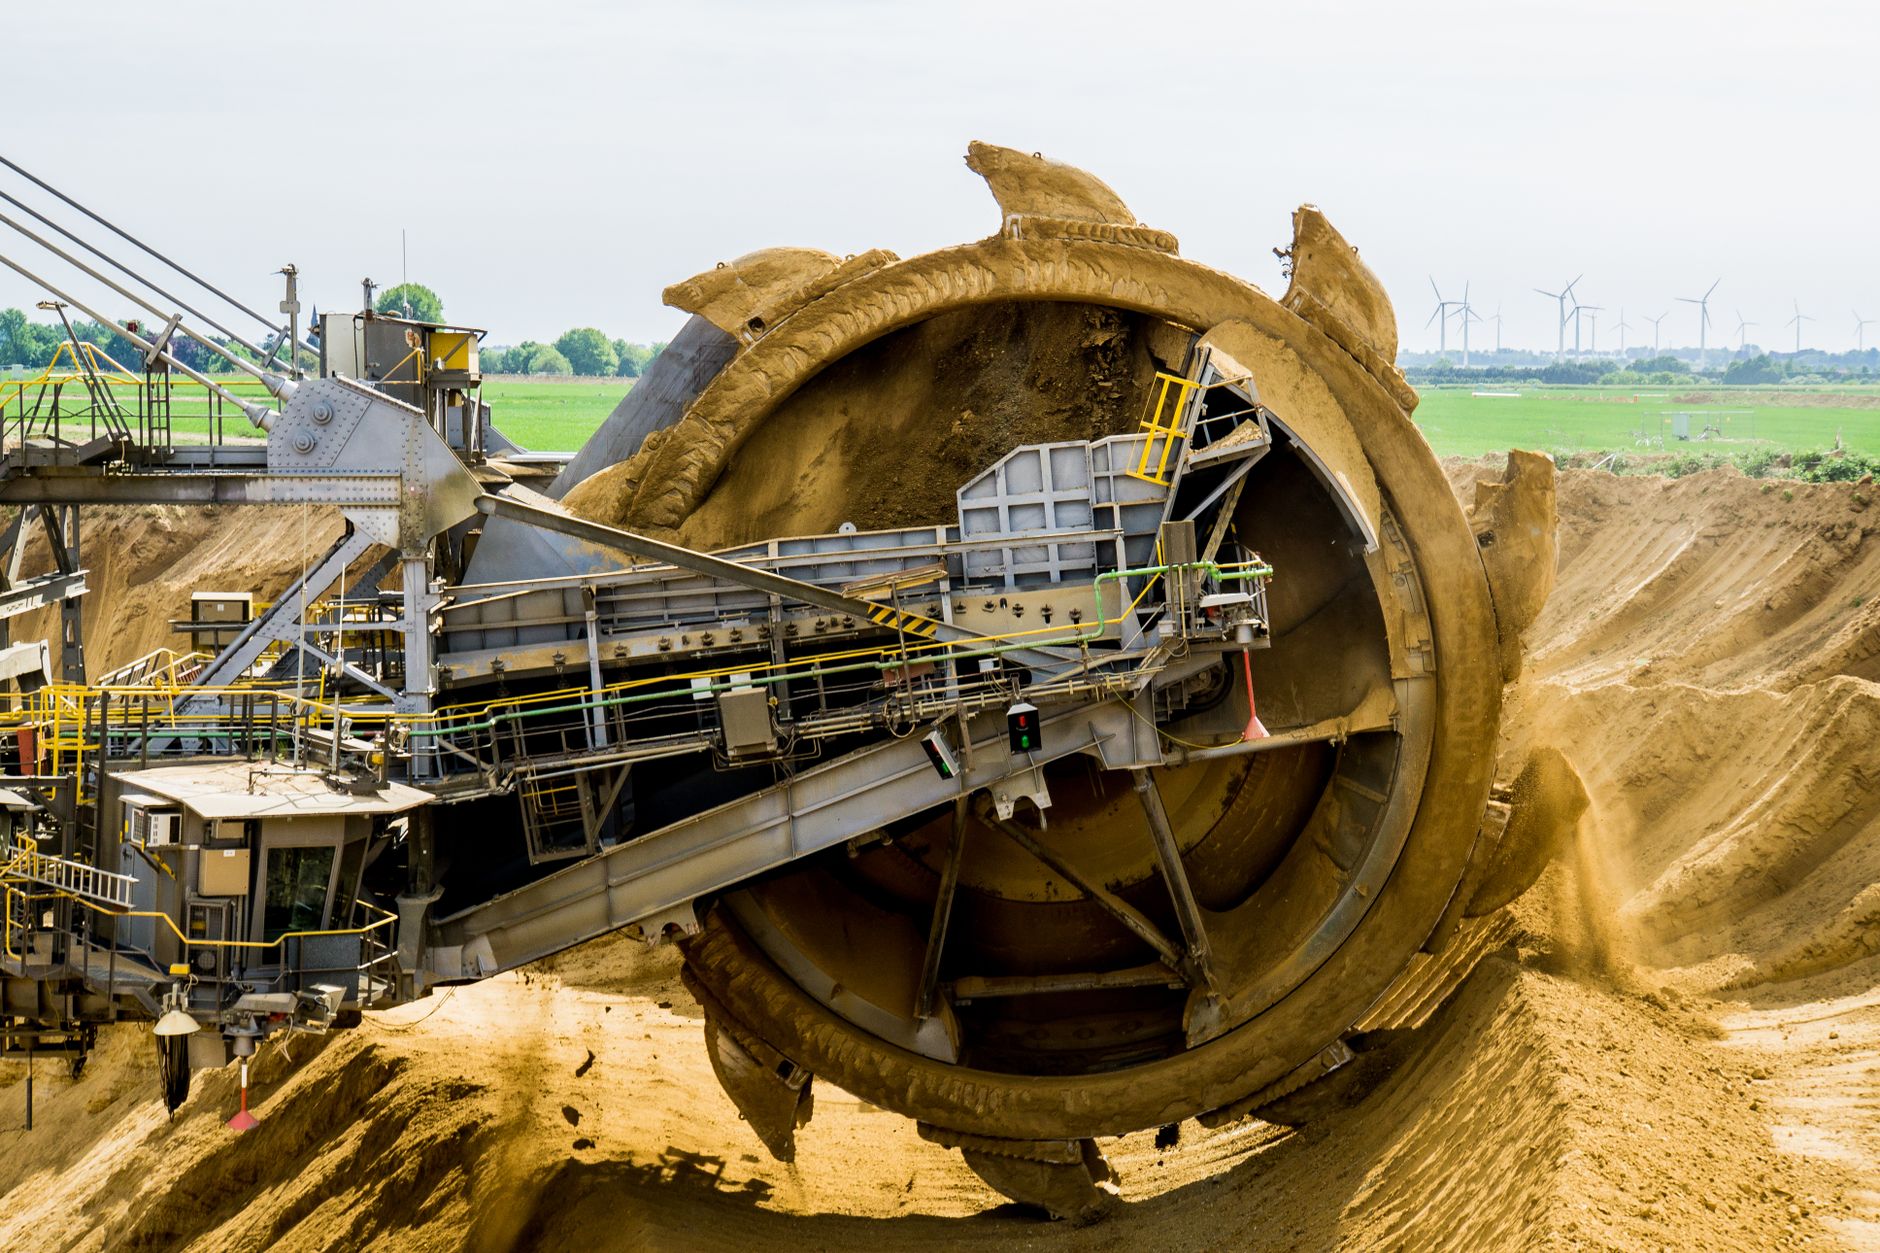
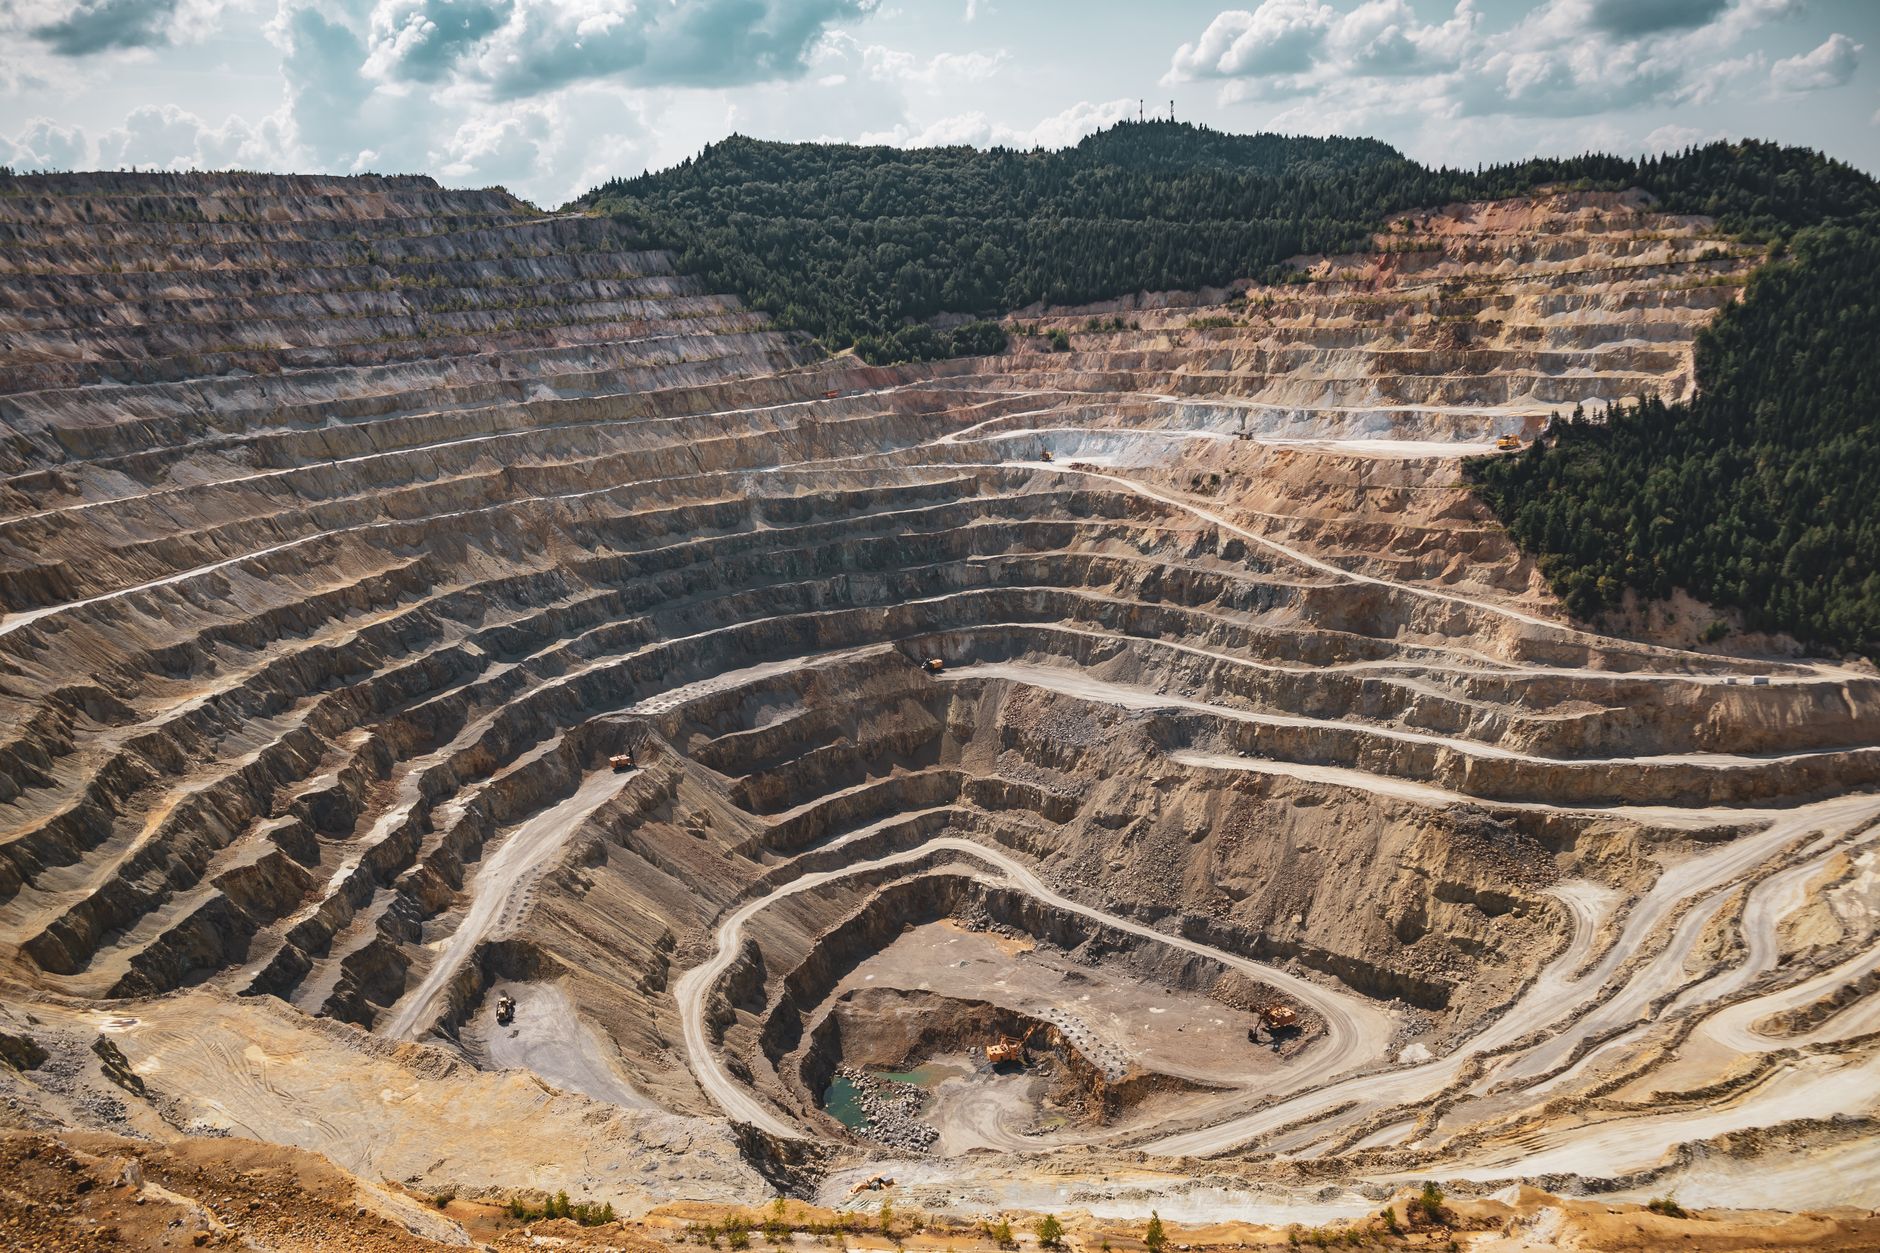
Viva Gold Corp. engages in the acquisition, exploration, and development of mineral properties in the United States. The company explores for gold and precious metal deposits. It holds 100% interest in the Tonopah Gold Project comprising 508 unpatented mineral claims covering an area of approximately 4,092 hectares located in the Walker Lane Trend in Western Nevada. The company was formerly known as Aintree Resources Inc. and changed its name to Viva Gold Corp. in January 2018. Viva Gold Corp. was incorporated in 2009 and is based in Langley, Canada.
Financials
- Revenue (TTM)
- $0
- EBITDA
- $-2.18M
- Profit Margin
- 0.00%
- ROE (TTM)
- -107.25%
- EPS (Diluted)
- -0.01
- Book Value
- 0.03
Classification
- Sector
- Materials
- Industry
- Metals & Mining
- Group
- Materials
Advertisement
7 stocks to buy and hold forever
Blue-chip dividend stocks for long-term wealth building.
Get the FREE ReportExplore More
Common Questions About VAU
Articles Featuring VAU.V
Latest articles and analysis covering VAU.V
Why Viva Gold Corp stock is skyrocketing today
Viva Gold Corp's stock surged by 9.09% today, driven by investor enthusiasm over promising drilling results from its Tonopah Gold Project, showcasing the potential for high-grade gold deposits.
Why Viva Gold Corp stock is skyrocketing today
Viva Gold Corp's stock soared by 9.09% today, driven by positive drilling results from its Tonopah Gold Project. This surge indicates strong investor confidence in the company's future.

Why Viva Gold Corp stock is sliding today
Viva Gold Corp's stock slid by 4.17% in the last session, closing at CA$0.12, raising questions about the company's near-term prospects and market confidence.
Viva Gold Corp (VAU.V) Set to Report Earnings — What to Watch on June 23
Viva Gold Corp (VAU.V) is set to report earnings on June 23, 2026. Investors should watch for signs of financial recovery amid ongoing challenges.