South Bow Corporation (SOBO : TSX)
Common Stock
$54.46
CAD
+0.33 (0.61%)
Last updated: 2026-07-23
Dividend Declared
25 days ago$0.7100 CAD per share dividend. Ex-dividend date: June 30, 2026
Get SOBO alerts:
SOBO
South Bow Corporation
Performance
1 Day
+0.61%
1 Week
+3.05%
1 Month
+5.71%
YTD
+42.34%
Key Statistics
Market Cap
$11.36B
52W High
$54.90
52W Low
$33.07
P/E Ratio
19.18
50 Day MA
$51.50
200 Day MA
$43.52
Beta
-
Dividend Yield
3.69%
Technical Indicators
Price vs 50-Day SMA
Price vs 200-Day SMA
Recent Price History
| Date | Open | High | Low | Close | Adj Close | Volume |
|---|---|---|---|---|---|---|
| 7/23/2026 | $54.13 | $54.73 | $53.99 | $54.46 | $54.46 | 434,933 |
| 7/22/2026 | $53.25 | $54.37 | $53.25 | $54.13 | $54.13 | 983,153 |
| 7/21/2026 | $52.64 | $52.89 | $52.27 | $52.84 | $52.84 | 552,180 |
| 7/20/2026 | $53.33 | $53.60 | $52.45 | $52.48 | $52.48 | 339,666 |
| 7/17/2026 | $53.40 | $53.72 | $52.56 | $53.01 | $53.01 | 699,051 |
| 7/16/2026 | $52.89 | $53.27 | $52.66 | $52.85 | $52.85 | 410,360 |
| 7/15/2026 | $52.71 | $53.40 | $52.61 | $52.77 | $52.77 | 337,732 |
| 7/14/2026 | $52.80 | $53.30 | $52.44 | $52.79 | $52.79 | 375,076 |
| 7/13/2026 | $51.69 | $52.99 | $51.56 | $52.66 | $52.66 | 732,896 |
| 7/10/2026 | $51.51 | $51.57 | $50.74 | $51.11 | $51.11 | 730,444 |
Analyst Price Targets
Based on analyst covering SOBO
Wall Street analysts forecast SOBO stock price to fall 13.9% over the next 12 months.
Consensus
Moderately BearishBased on avg. target vs last close (formal rating unavailable for Canadian listings)
Avg. Target
C$46.89
-13.9% Upside
Current Price
C$54.46
Last close
Analyst ratings and price targets are updated periodically. Not financial advice.
Wealth Awesome Price Forecast
WA ModelStatistical 90-day price range based on SOBO's historical volatility
30-Day Vol
24.8%
Annualized
90-Day Vol
23.9%
Annualized
Trend (90d)
+50.0%
Annualized drift
90d Mean
C$65.11
Expected price
| Horizon | Expected | 68% Range (1σ) |
|---|---|---|
| 30 trading days | C$57.80 | C$53.05 – C$62.97 |
| 60 trading days | C$61.35 | C$54.34 – C$69.25 |
| 90 trading days | C$65.11 | C$56.13 – C$75.52 |
Methodology: Range is calculated using 30-day realized volatility via geometric Brownian motion (log-normal model). 68% band = ±1σ, 95% band = ±2σ. This is a statistical model, not a prediction. Past volatility does not guarantee future results. Not financial advice.
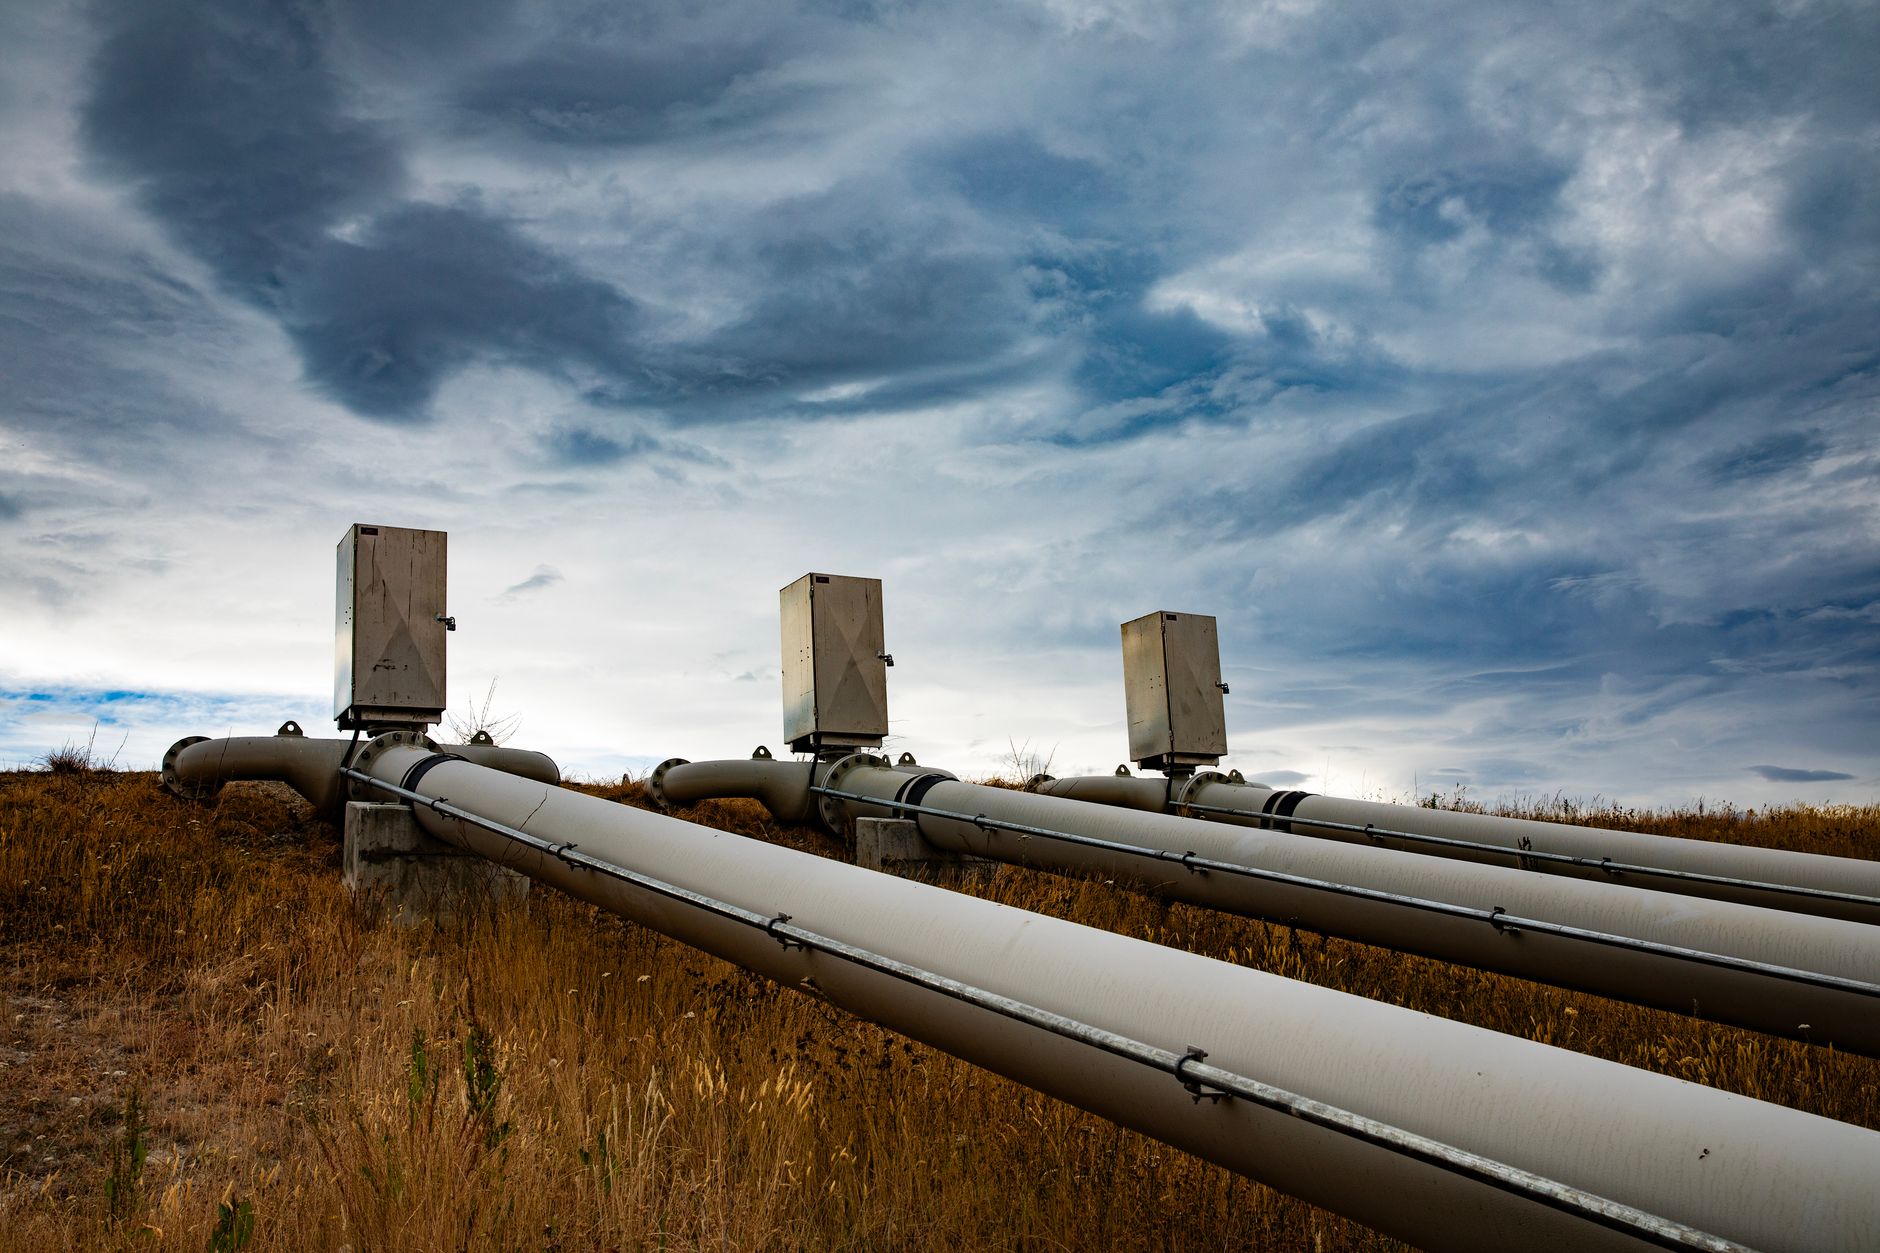
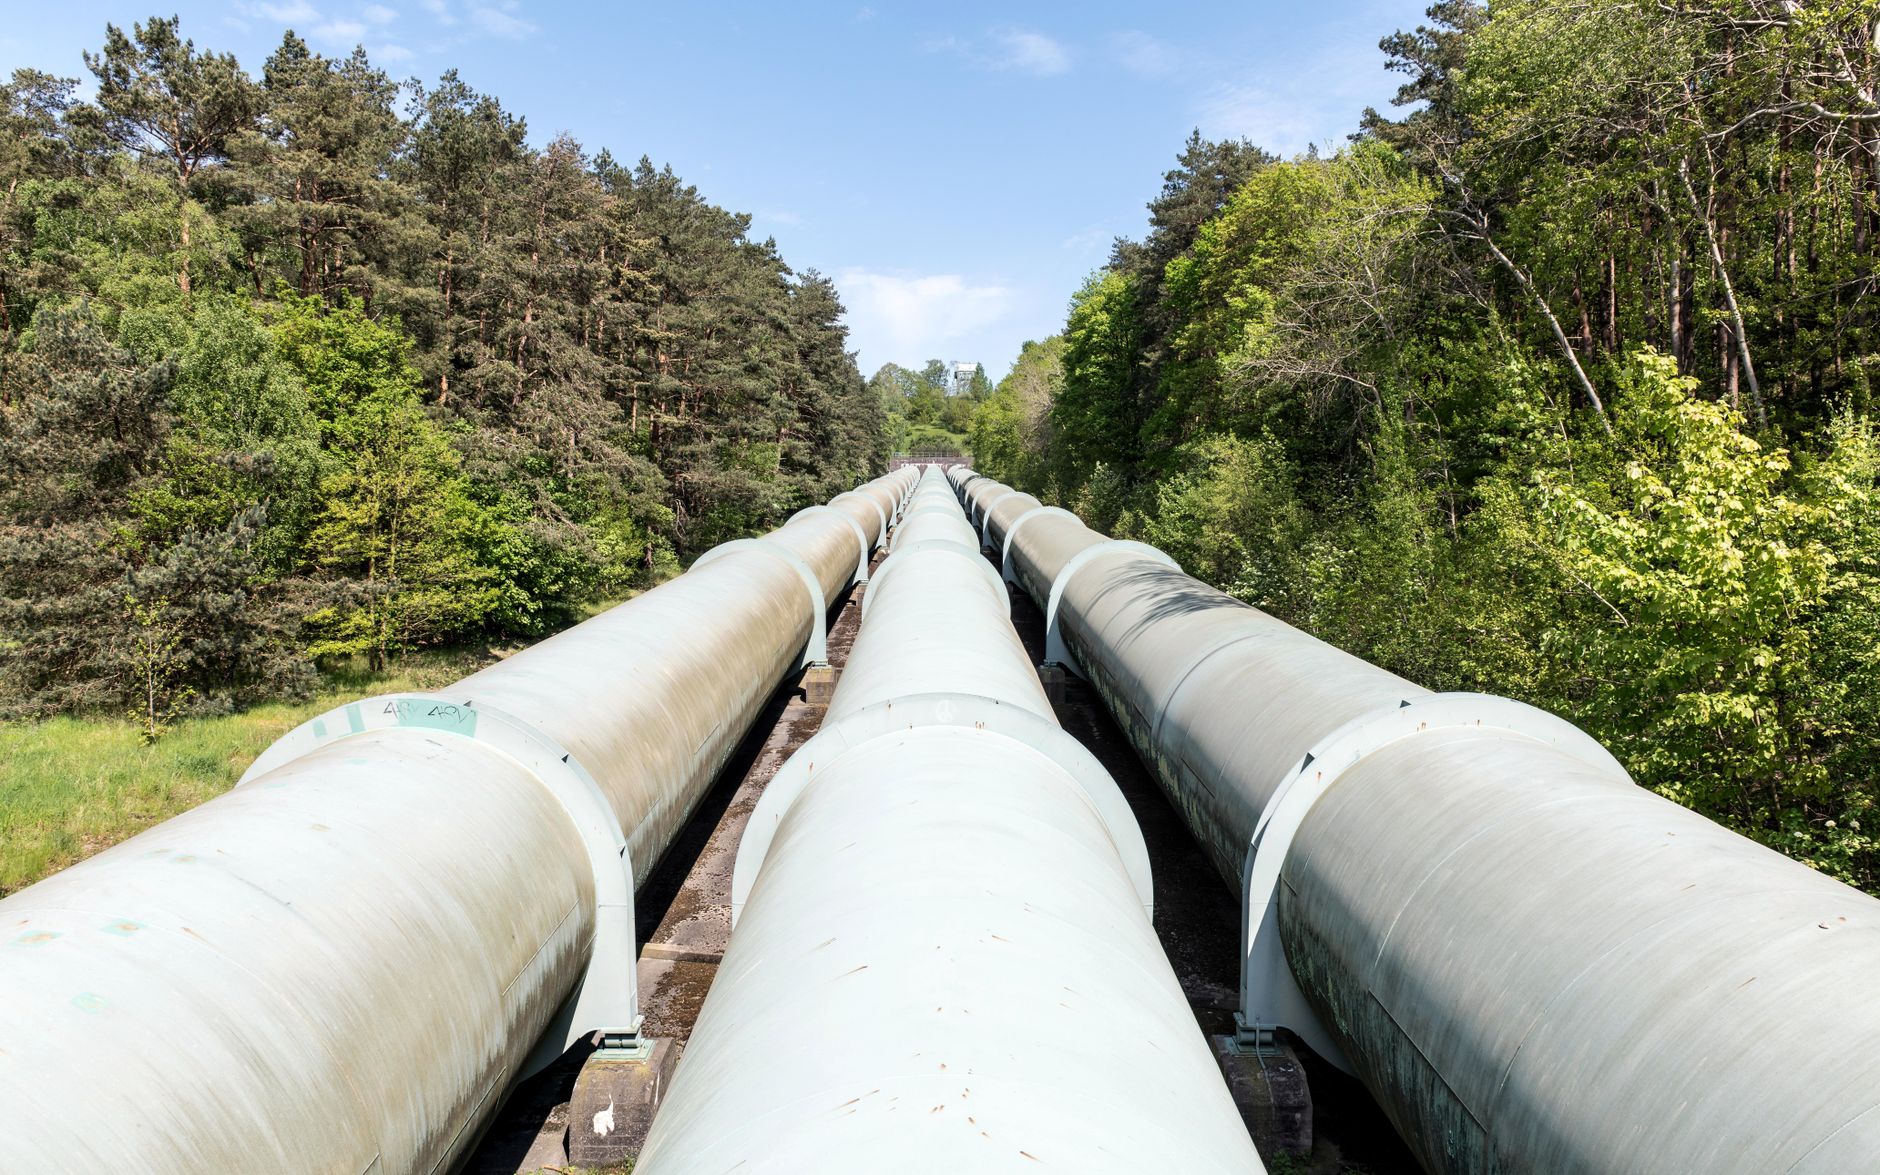
About South Bow Corporation
South Bow Corporation operates as an energy infrastructure company. It operates through three segments: Keystone Pipeline System, Marketing, and Intra-Alberta & Other. The Keystone Pipeline System segment consists of the company's main liquids pipeline network, which transports crude oil from Hardisty, Alberta, to key U.S. markets including Wood River, Patoka, Illinois, Cushing, Oklahoma, and the Gulf Coast. The Marketing segment provides crude oil marketing services, including transportation, storage, and logistics, and engages in physical crude oil trading and hedging activities. The Intra-Alberta & Other segment comprises pipelines such as the Grand Rapids Pipeline and White Spruce Pipeline, offering crude oil transportation from Alberta's oil sands to refining and market regions, and includes corporate and financing activities. The company also operates 4,900 kilometres of crude oil pipeline infrastructure connecting Alberta crude oil supplies to the U.S. refining markets in the U.S. Midwest and Gulf Coast. In addition, the company offers ancillary services, including storage at terminals. The company was incorporated in 2023 and is based in Calgary, Canada.
Financials
- Revenue (TTM)
- $1.98B
- EBITDA
- $953.00M
- Profit Margin
- 21.32%
- ROE (TTM)
- 16.04%
- EPS (Diluted)
- 2.84
- Book Value
- 18.12
Recent Dividends
$0.7100CAD
Ex: Jun 30, 2026
$0.6850CAD
Ex: Dec 31, 2025
$0.6970CAD
Ex: Sep 29, 2025
$0.6840CAD
Ex: Jun 30, 2025
Pay: Jul 15
$0.7160CAD
Ex: Mar 31, 2025
Pay: Apr 15
$0.7180CAD
Ex: Dec 31, 2024
Pay: Jan 31
Advertisement
7 stocks to buy and hold forever
Blue-chip dividend stocks for long-term wealth building.
Get the FREE ReportExplore More
Common Questions About SOBO
Articles Featuring SOBO.TO
Latest articles and analysis covering SOBO.TO
What's Going On With South Bow Corporation Stock Thursday?
South Bow Corporation has been on an upward trajectory this week, with shares closing at C$54.34. The company recently reported its Q4 and year-end 2025 results, enhancing investor sentiment. As the stock approaches its 52-week high, market participants are closely monitoring its performance.

What's Going On With South Bow Corporation Stock Friday?
South Bow Corporation's stock has experienced slight fluctuations recently, but its impressive year-to-date performance and strong fundamentals may appeal to long-term investors. Recent announcements regarding operational results and projects could influence future market perceptions.

Why South Bow Corporation stock is rising today
South Bow Corporation's stock has risen by 3.13%, closing at CA$52.71, driven by positive investor sentiment and strong financial fundamentals.

Why South Bow Corporation stock is rising today
South Bow Corporation's stock has risen by 4.26%, driven by investor confidence and solid operational results. With a strong market cap and favorable metrics, the company is positioned for growth.

Why South Bow Corporation stock is rising today
South Bow Corporation's stock has risen by 3.12% today, driven by exciting news about a new pipeline project that could significantly enhance Canada's crude oil export capacity.
Why South Bow Corporation stock is sliding today
South Bow Corporation's stock fell 2.94% in the last trading session, reflecting investor concerns over its new pipeline project and market logistics.

Why South Bow Corporation stock is tanking today
South Bow Corporation's stock has dropped 1.90% today, closing at CA$49.96, raising concerns among investors about its future performance.

Why South Bow Corporation stock is tanking today
South Bow Corporation's stock has faced a setback, closing down 1.77% yesterday. Investors are left wondering about the company's future performance and upcoming financial results.

Why South Bow Corporation stock is tanking today
South Bow Corporation's stock has dropped 1.26% today, closing at CA$51.04. Investors are wary of the company's delayed decisions on major pipeline projects, despite a recent positive outlook from Raymond James.
South Bow Corporation Surges After Strong Dividend Announcement
South Bow Corporation's stock gained significantly in the last session, driven by a strong dividend announcement and operational performance.
Why South Bow Corporation stock is rising today
South Bow Corporation's stock rose by 4.02% after Raymond James initiated coverage with an 'Outperform' rating and a price target of $60. This bullish outlook is a key driver of the stock's recent performance.

Why South Bow Corporation stock is tanking today
South Bow Corporation's stock fell 1.56% in the last trading session, closing at CA$50.57. This decline comes amid a backdrop of recent financial disclosures and shareholder meetings, prompting investors to reevaluate their positions.