AbraSilver Resource Corp. (ABRA : TSX)
Common Stock
$14.24
CAD
+0.26 (1.86%)
Last updated: 2026-07-20
ABRA
AbraSilver Resource Corp.
Performance
1 Day
+1.86%
1 Week
-3.20%
1 Month
+4.63%
YTD
+34.47%
Key Statistics
Market Cap
$2.25B
52W High
$19.89
52W Low
$5.11
P/E Ratio
-
50 Day MA
$15.56
200 Day MA
$12.43
Beta
1.91
Dividend Yield
-
Technical Indicators
Price vs 50-Day SMA
Price vs 200-Day SMA
Recent Price History
| Date | Open | High | Low | Close | Adj Close | Volume |
|---|---|---|---|---|---|---|
| 7/20/2026 | $13.88 | $14.35 | $13.71 | $14.24 | $14.24 | 362,160 |
| 7/17/2026 | $13.25 | $14.24 | $13.18 | $13.98 | $13.98 | 336,422 |
| 7/16/2026 | $14.00 | $14.24 | $13.60 | $13.74 | $13.74 | 419,425 |
| 7/15/2026 | $14.66 | $15.16 | $13.93 | $14.57 | $14.57 | 400,716 |
| 7/14/2026 | $15.35 | $15.57 | $14.58 | $14.79 | $14.79 | 386,528 |
| 7/13/2026 | $14.20 | $15.01 | $14.09 | $14.71 | $14.71 | 795,594 |
| 7/10/2026 | $13.66 | $14.18 | $13.58 | $14.01 | $14.01 | 225,102 |
| 7/9/2026 | $13.45 | $13.95 | $13.36 | $13.79 | $13.79 | 386,186 |
| 7/8/2026 | $13.02 | $13.38 | $12.53 | $13.03 | $13.03 | 416,564 |
| 7/7/2026 | $13.90 | $13.92 | $13.23 | $13.48 | $13.48 | 404,415 |
Analyst Price Targets
Based on analyst covering ABRA
Wall Street analysts forecast ABRA stock price to rise 47.5% over the next 12 months.
Consensus
BullishBased on avg. target vs last close (formal rating unavailable for Canadian listings)
Avg. Target
C$21.00
+47.5% Upside
Current Price
C$14.24
Last close
Analyst ratings and price targets are updated periodically. Not financial advice.
Wealth Awesome Price Forecast
WA ModelStatistical 90-day price range based on ABRA's historical volatility
30-Day Vol
72.8%
Annualized
90-Day Vol
83.9%
Annualized
Trend (90d)
-50.0%
Annualized drift
90d Mean
C$11.91
Expected price
| Horizon | Expected | 68% Range (1σ) |
|---|---|---|
| 30 trading days | C$13.42 | C$10.44 – C$17.25 |
| 60 trading days | C$12.64 | C$8.86 – C$18.03 |
| 90 trading days | C$11.91 | C$7.71 – C$18.40 |
Methodology: Range is calculated using 30-day realized volatility via geometric Brownian motion (log-normal model). 68% band = ±1σ, 95% band = ±2σ. This is a statistical model, not a prediction. Past volatility does not guarantee future results. Not financial advice.
About AbraSilver Resource Corp.
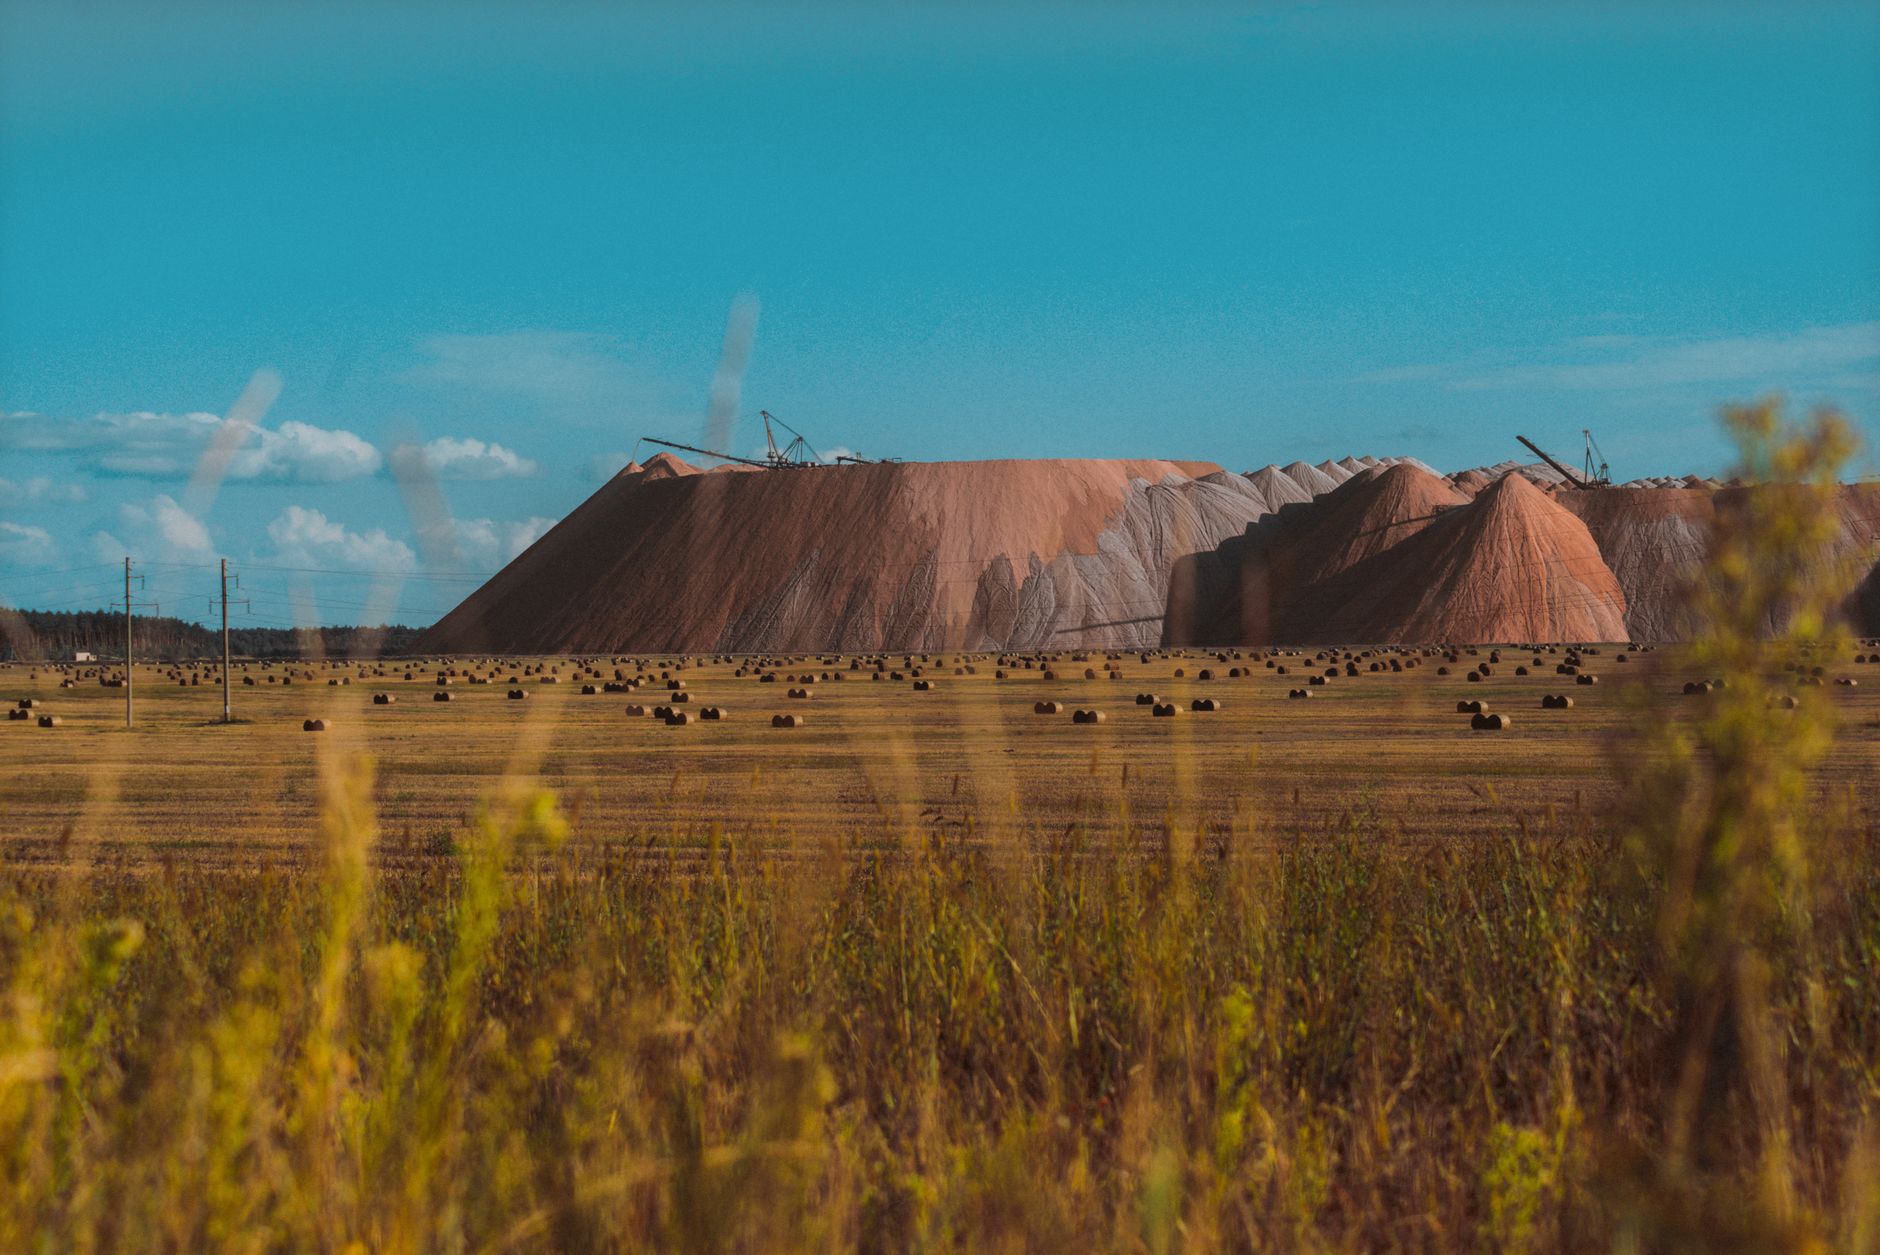
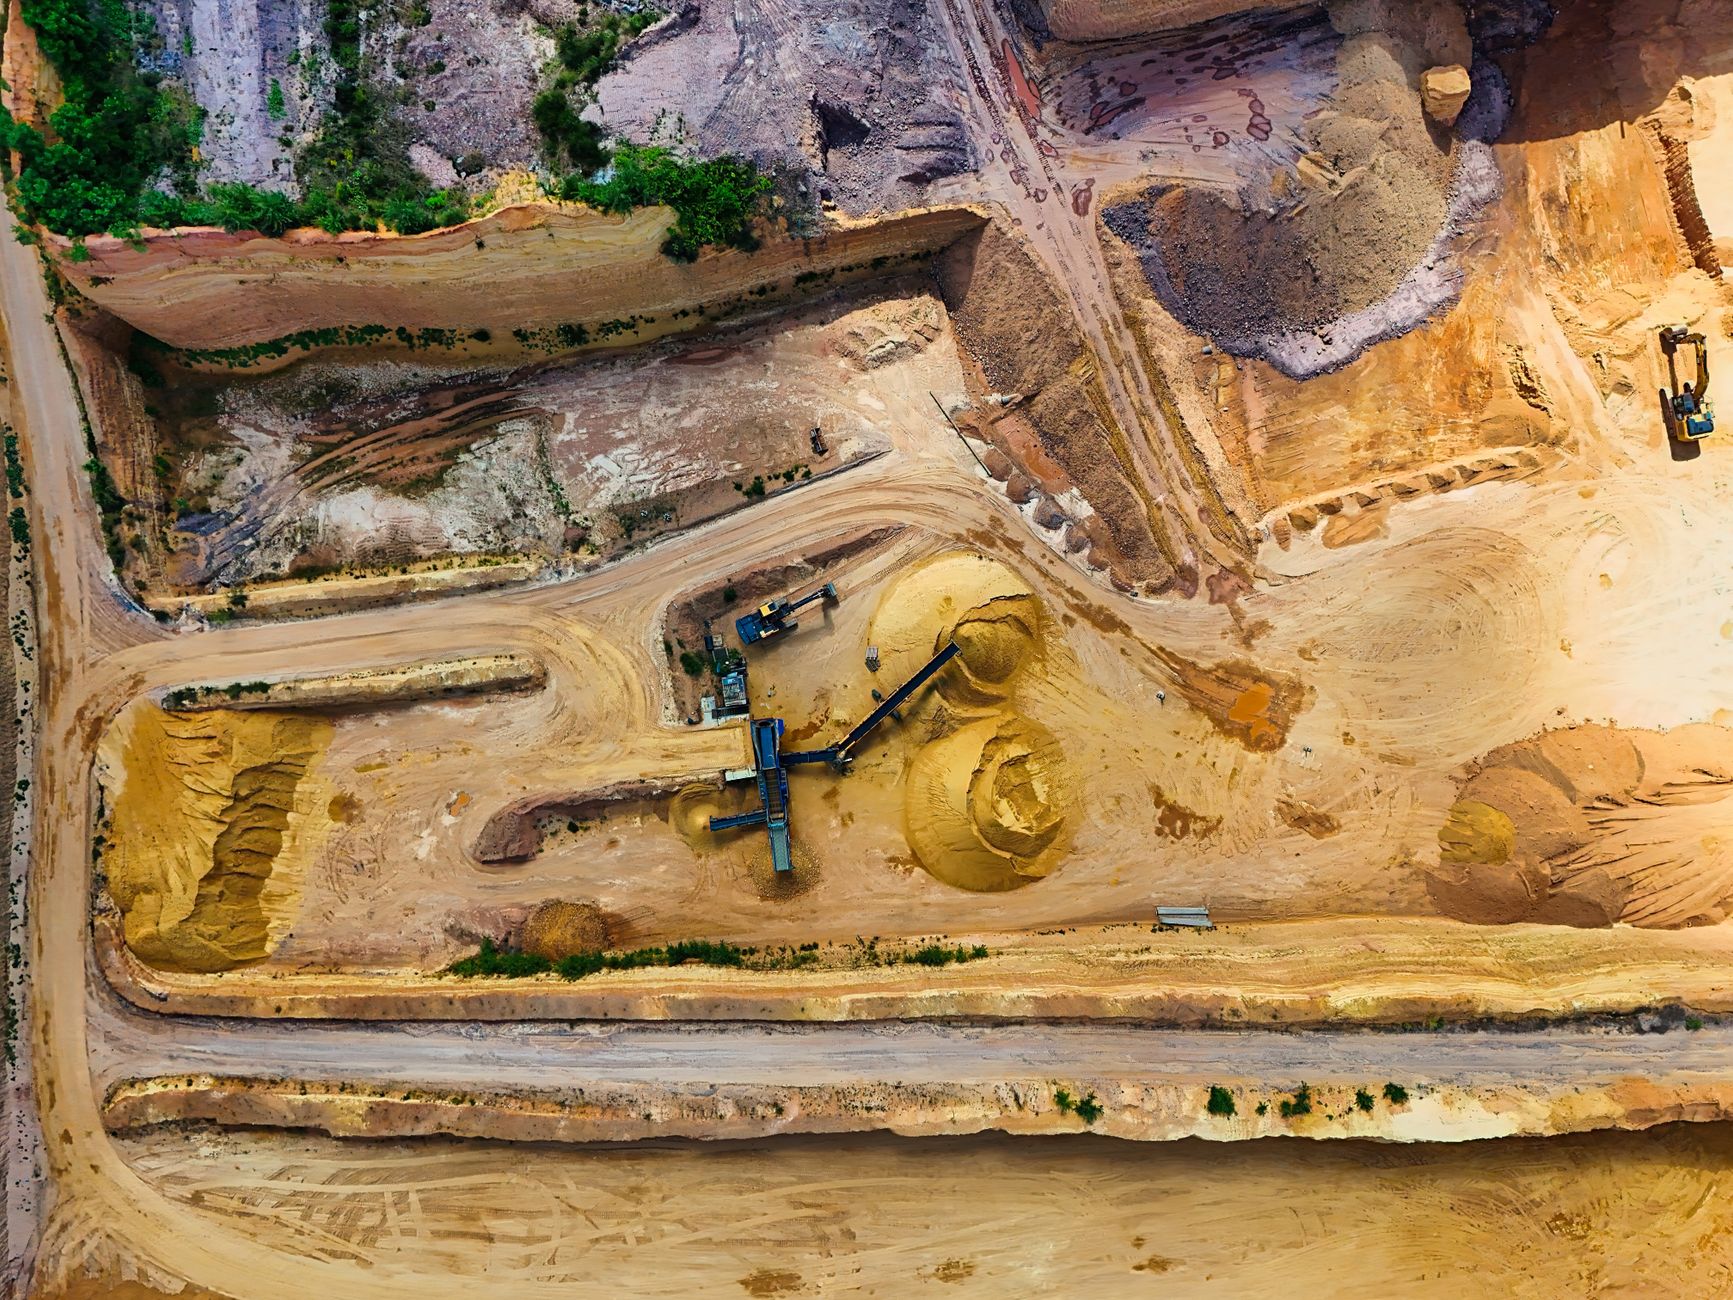
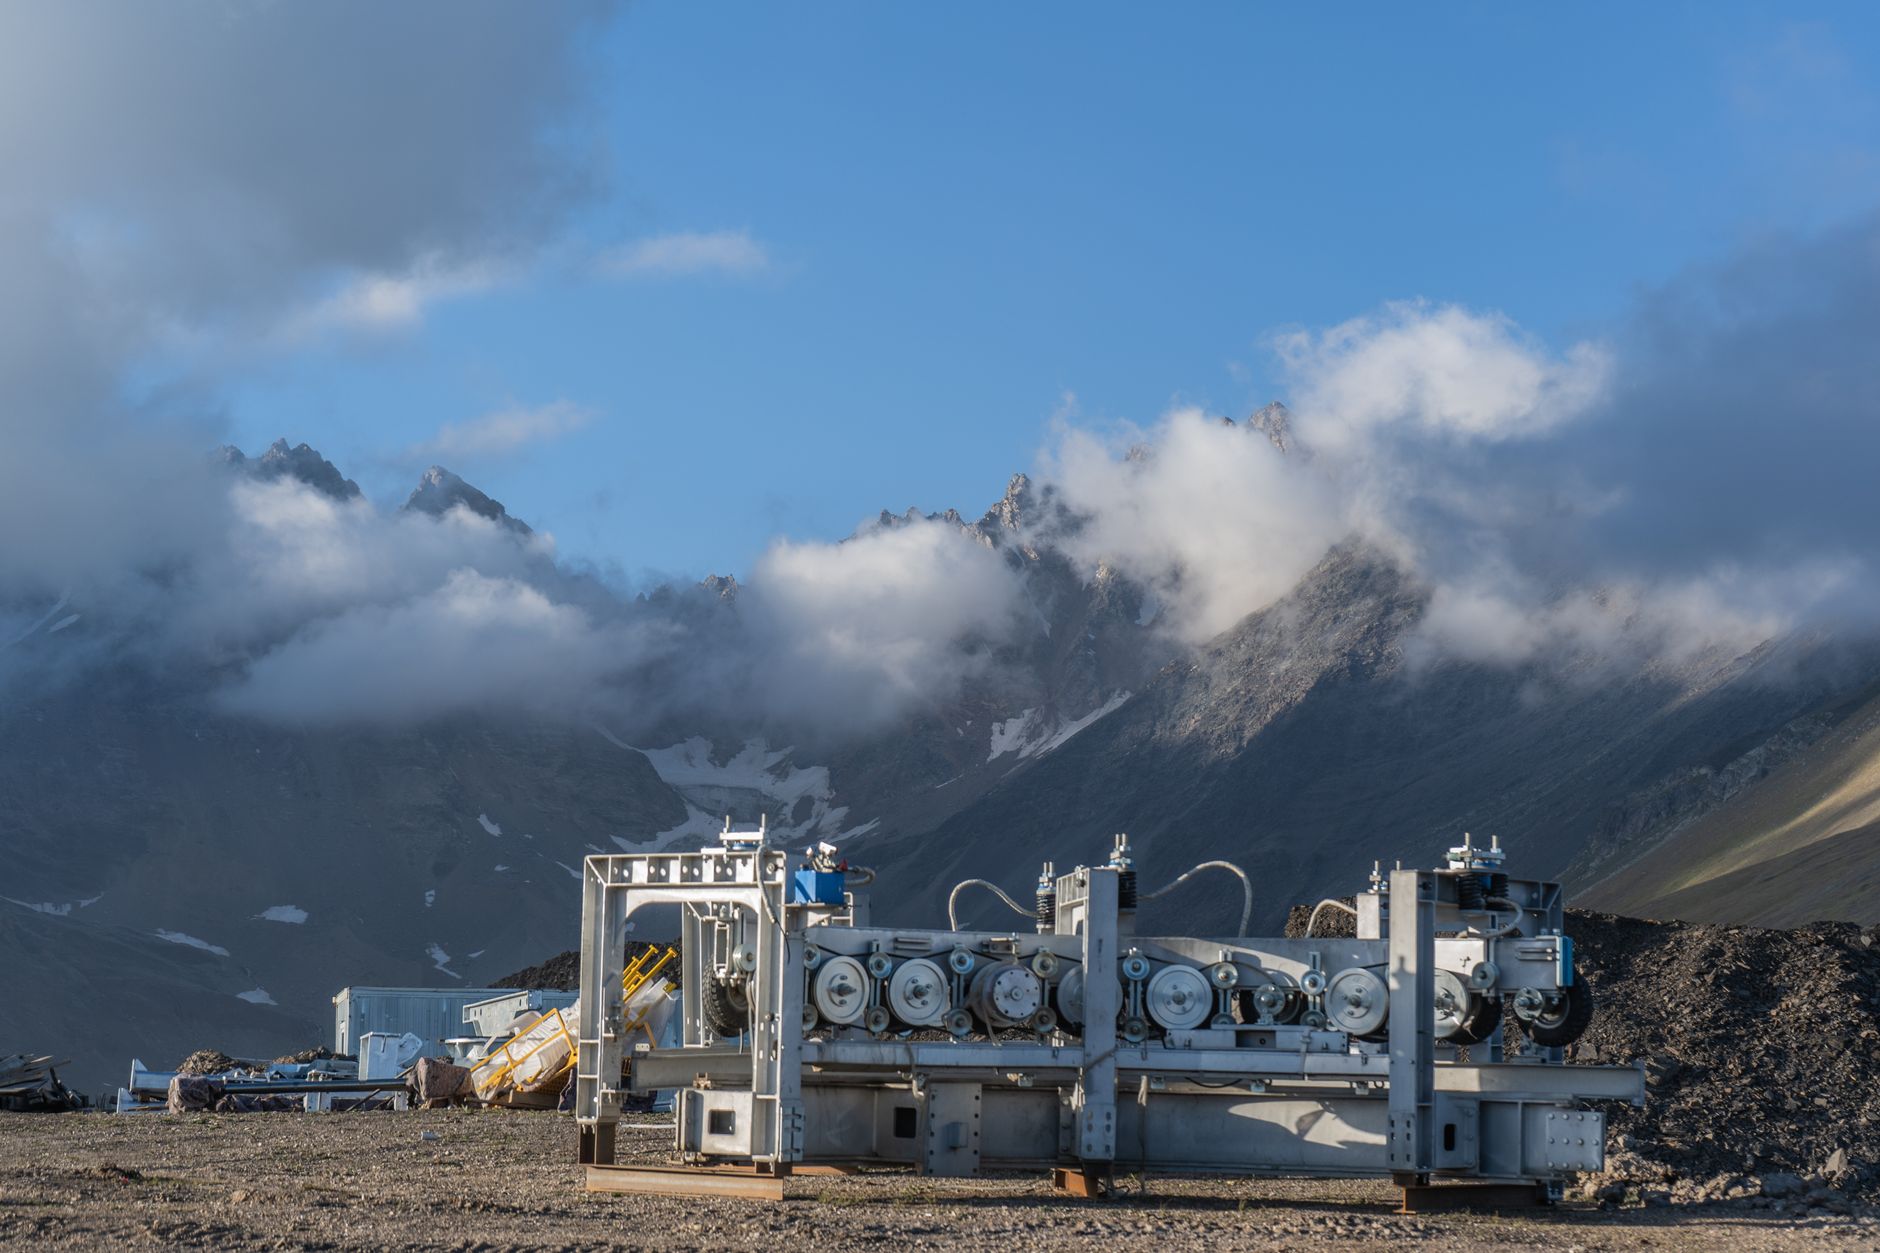
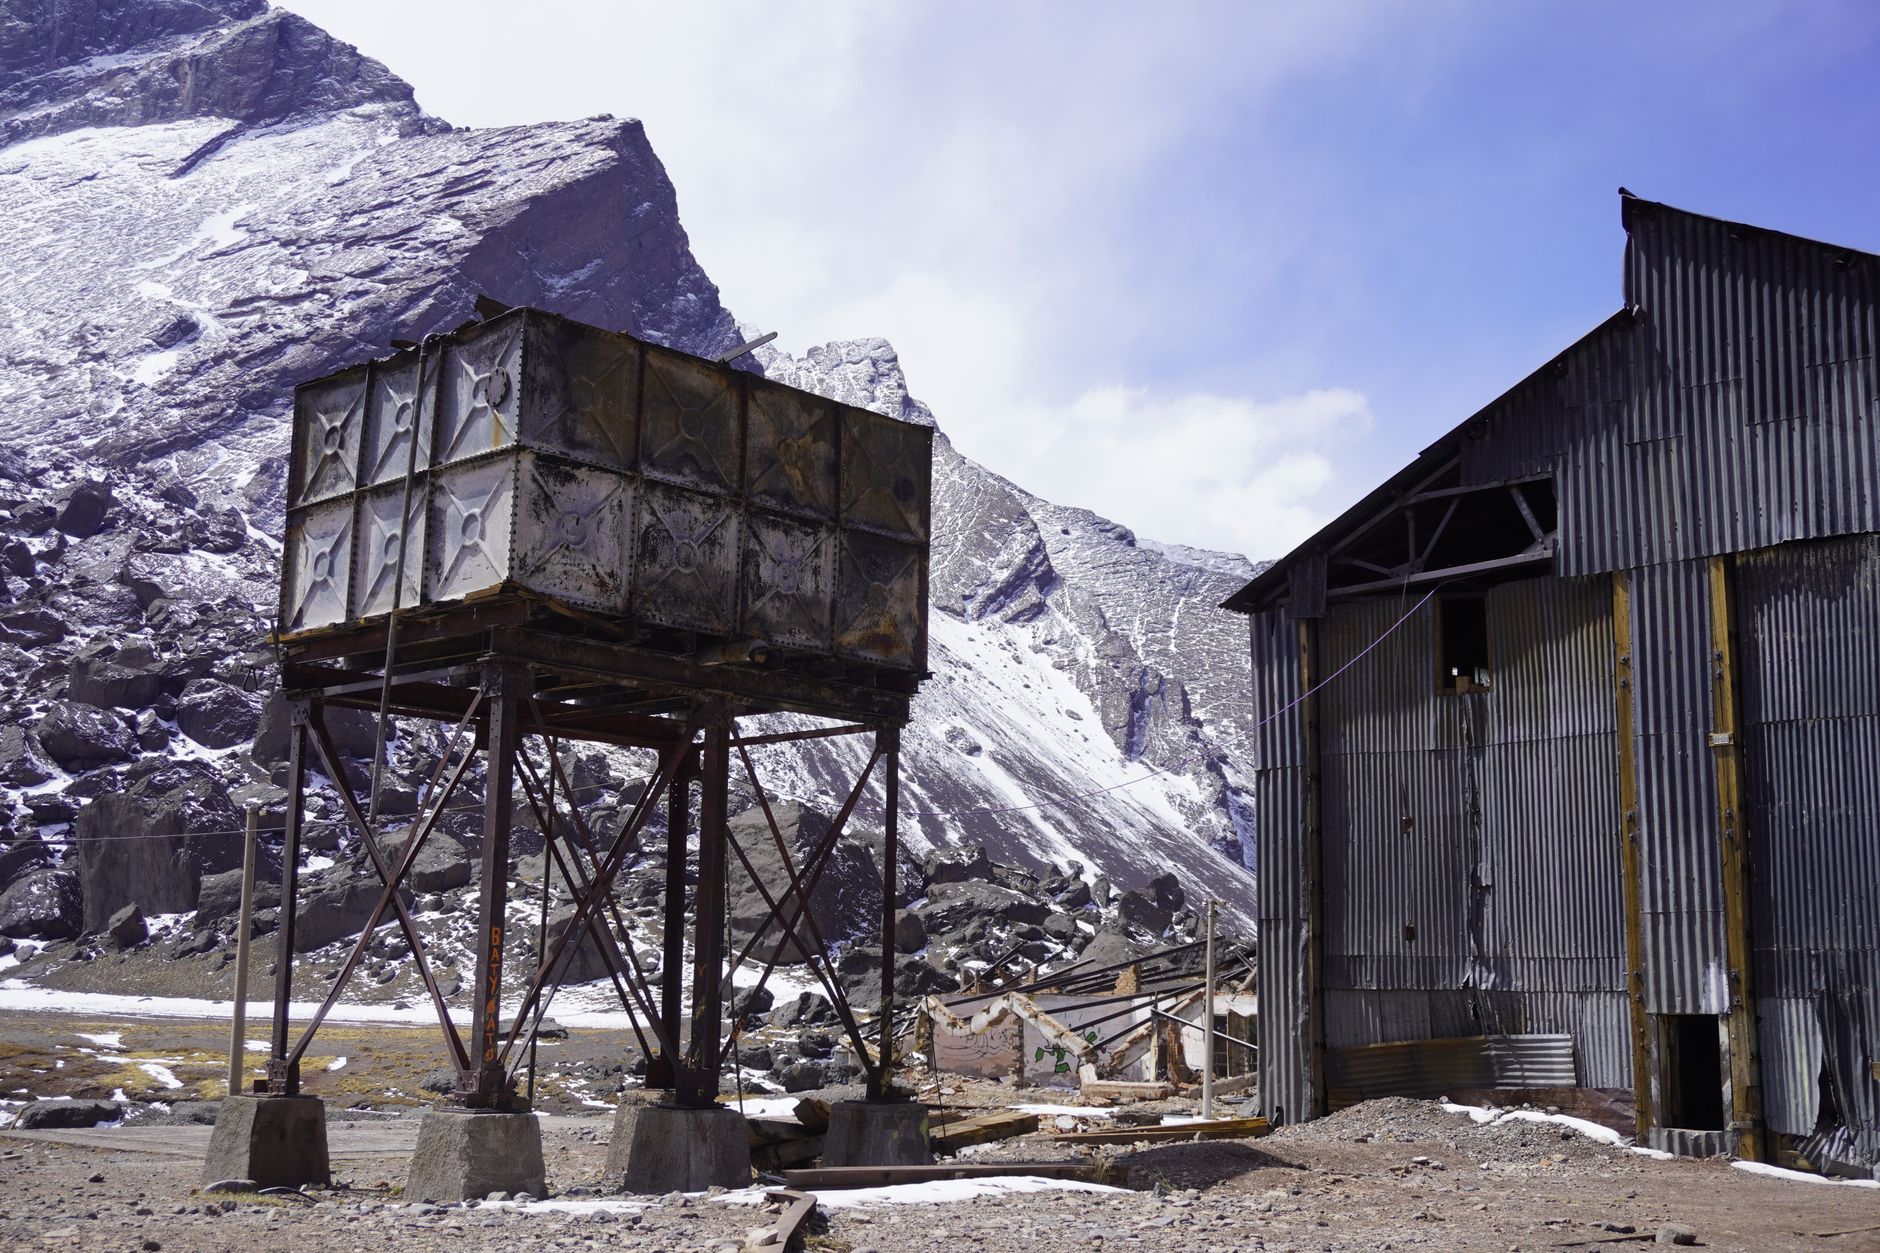
AbraSilver Resource Corp. operates as an exploration company in Argentina, the United States, and Canada. It primarily explores for silver, gold, copper, and other metals. The company holds interest in its flagship property, the Diablillos property covering an area of 79 kilometer square located in the Puna region of Argentina. The company was formerly known as AbraPlata Resource Corp. and changed its name to AbraSilver Resource Corp. in March 2021. AbraSilver Resource Corp. was incorporated in 1993 and is headquartered in Toronto, Canada.
Financials
- Revenue (TTM)
- $0
- EBITDA
- $-63.22M
- Profit Margin
- 0.00%
- ROE (TTM)
- -85.81%
- EPS (Diluted)
- -0.41
- Book Value
- 0.43
Advertisement
7 stocks to buy and hold forever
Blue-chip dividend stocks for long-term wealth building.
Get the FREE ReportExplore More
Common Questions About ABRA
Articles Featuring ABRA.TO
Latest articles and analysis covering ABRA.TO
Why AbraSilver Resource Corp. stock is skyrocketing today
AbraSilver Resource Corp. stock is experiencing a notable rise today, fueled by investor optimism and recent positive developments in its mining projects.

What's Going On With AbraSilver Resource Corp. Stock Monday?
AbraSilver Resource Corp. has experienced a decline in stock price amid a backdrop of broader market dynamics. With no significant company news this week, the technical indicators suggest caution, though analyst targets remain optimistic.

Why AbraSilver Resource Corp. stock is rising today
AbraSilver Resource Corp. has gained 2.69% in its latest trading session, driven by optimistic developments regarding its Diablillos project in Argentina.
Why AbraSilver Resource Corp. stock is plummeting today
AbraSilver Resource Corp.'s stock fell 5.77% today, closing at CA$13.73, raising concerns about its market position despite positive mineral resource updates.
AbraSilver Resource Corp. (ABRA.TO) Soars 15% This Week — What’s Behind the Surge?
AbraSilver Resource Corp. has surged 15% this week, driven by strategic acquisitions and positive investor sentiment. Here's what you need to know.
Why AbraSilver Resource Corp. stock is sliding today
AbraSilver Resource Corp. faced a setback today, with its stock price down 4.06%. This decline comes despite recent positive developments, including final environmental approval for its Diablillos project.
Why AbraSilver Resource Corp. stock is rising today
AbraSilver Resource Corp. has gained 5.00% in today's trading session, closing at CA$14.71, buoyed by positive developments in its Diablillos project.
What's Going On With AbraSilver Resource Corp. Stock Monday?
AbraSilver Resource Corp. has seen mixed stock performance recently, with a slight increase today but a notable decline this week. The company’s promising developments regarding its Diablillos project could influence investor sentiment moving forward.
Why AbraSilver Resource Corp. stock is rising today
AbraSilver Resource Corp. (ABRA.TO) has seen a notable increase in its stock price, closing up 4.30% at CA$13.59. This rise is attributed to positive market sentiment and promising developments in its mining projects.

Why AbraSilver Resource Corp. stock is plummeting today
AbraSilver Resource Corp. has seen its stock price drop 6.82% today, closing at CA$12.56. This decline raises questions about the company's future, especially in light of its recent project announcements.

AbraSilver Resource Corp. (ABRA.TO) Sees 10% Decline Over Past Week Amidst Feasibility Study News
AbraSilver Resource Corp. has seen a 10% decline in share price over the past week, raising concerns about investor confidence despite strong project fundamentals.

Why AbraSilver Resource Corp. stock is sliding today
AbraSilver Resource Corp. saw its stock price drop by 4.92% yesterday, closing at CA$14.10. This decline comes amid a lack of recent positive news and could signal concerns among investors regarding the company's future performance.

Why AbraSilver Resource Corp. stock is sliding today
AbraSilver Resource Corp. saw its stock slide by 3.44% in the last trading session, closing at CA$14.32. This decline raises questions about the company's future as it navigates investor sentiment in a challenging market.

Why AbraSilver Resource Corp. stock is skyrocketing today
AbraSilver Resource Corp. has experienced a significant stock price increase of 7.59% after releasing a promising Definitive Feasibility Study for its Diablillos project, highlighting its potential as a leading silver-gold operation.

Why AbraSilver Resource Corp. stock is skyrocketing today
AbraSilver Resource Corp. has seen a significant 5.65% increase in its stock price, driven by the release of its Definitive Feasibility Study that highlights robust project economics for the Diablillos silver-gold project.

Why AbraSilver Resource Corp. stock is skyrocketing today
AbraSilver Resource Corp. (ABRA.TO) is experiencing a significant 6.07% increase in stock price following the release of its Definitive Feasibility Study for the Diablillos silver-gold project, which positions it among the world's premier undeveloped mining projects.
Why AbraSilver Resource Corp. stock is gaining today
AbraSilver Resource Corp. has gained 1.48% today, driven by strong drilling results at its La Coipita project, which confirm the presence of a large-scale mineralized system.
Why AbraSilver Resource Corp. stock is plummeting today
AbraSilver Resource Corp.'s stock has plummeted by 7.88% today, closing at CA$14.74. This drop raises questions about the company's future, despite recent promising drilling results from the La Coipita project.

Why AbraSilver Resource Corp. stock is plummeting today
AbraSilver Resource Corp. saw its stock price drop by nearly 8% yesterday, despite reporting promising drilling results from its La Coipita project. This decline raises questions about market sentiment and investor confidence in the mining sector.
Why AbraSilver Resource Corp. stock is rising today
AbraSilver Resource Corp. (ABRA.TO) saw a 2.03% increase in stock price, buoyed by positive drill results from its La Coipita project, indicating significant mineralization and potential for future growth.

Showing latest 20 articles