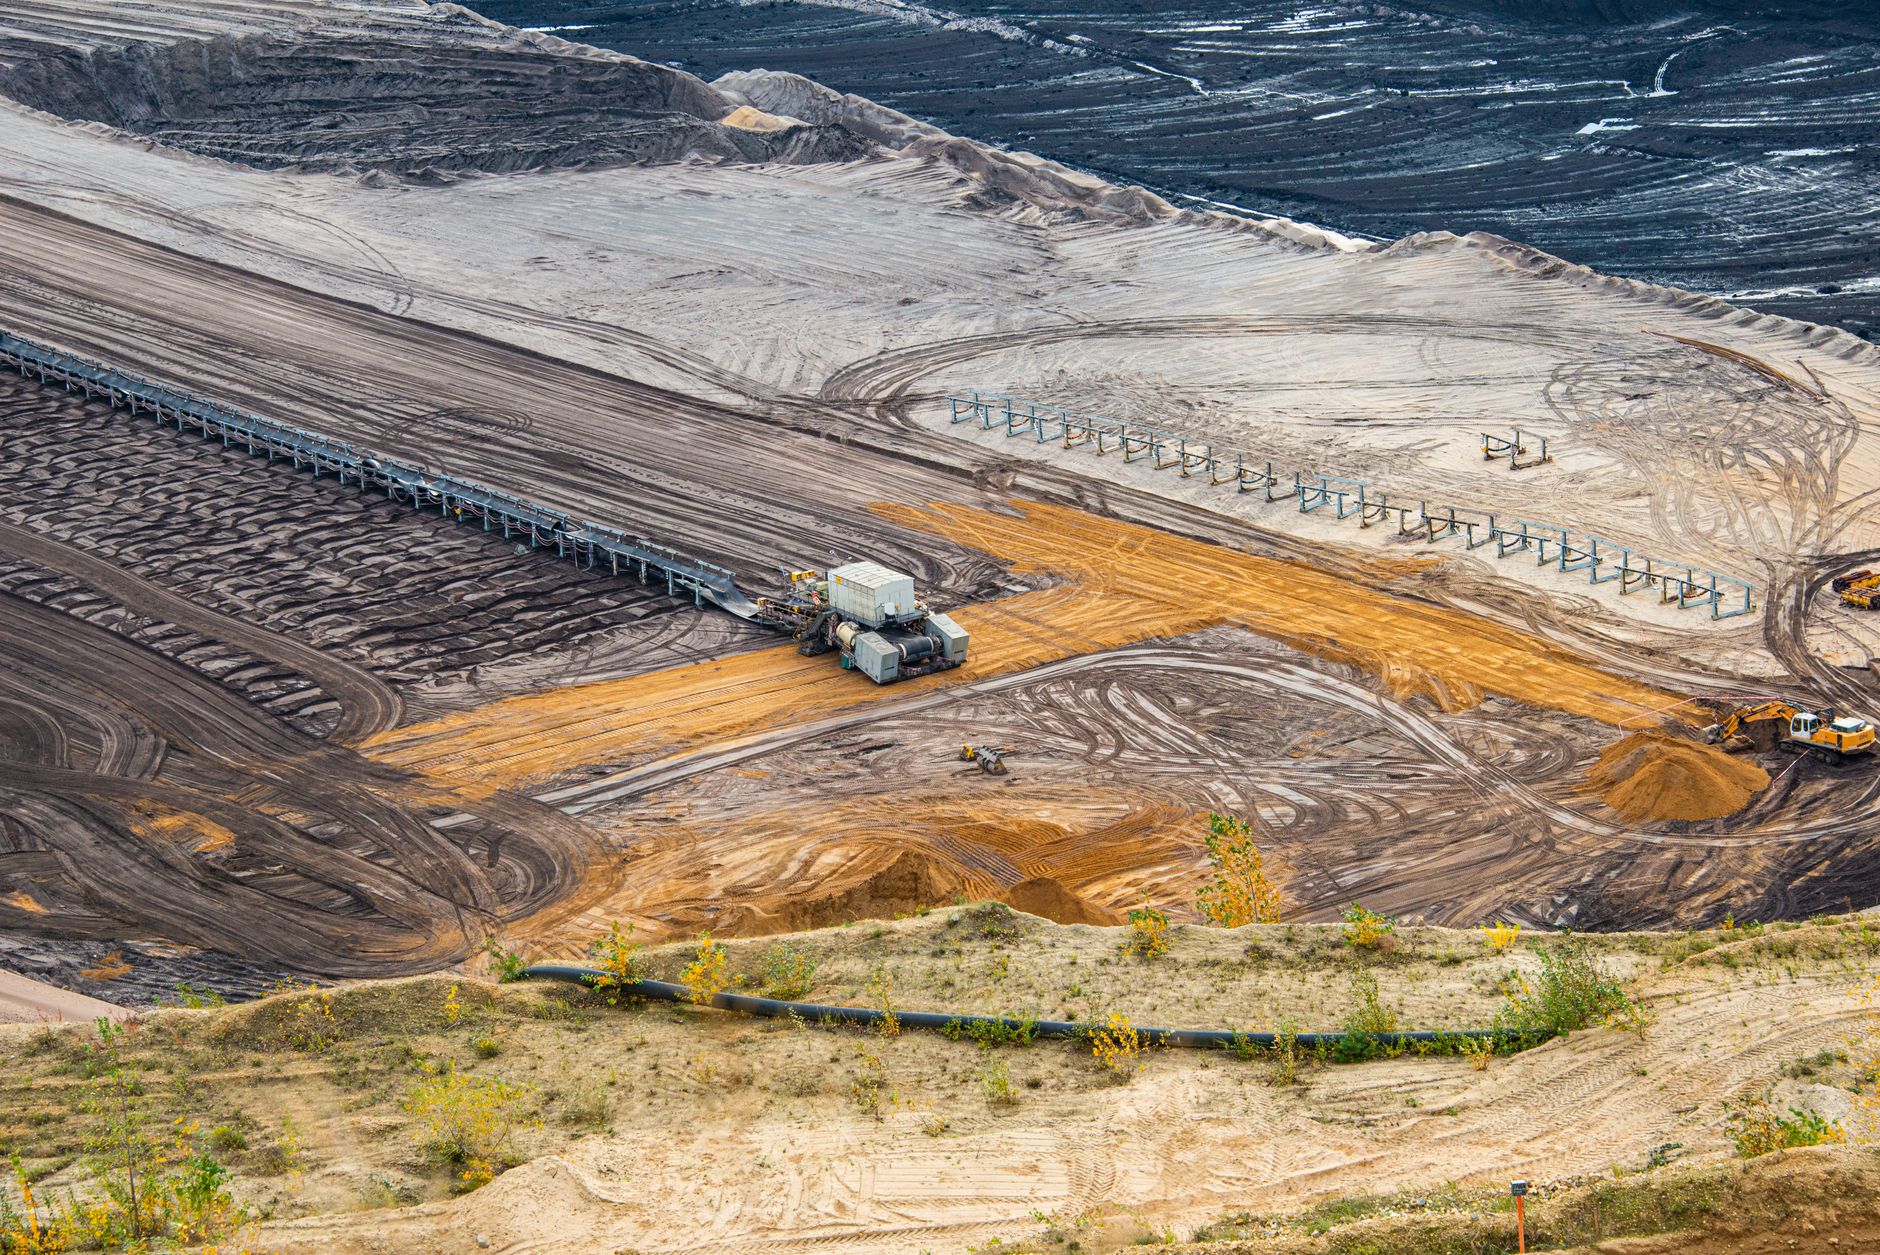
GoldMining Inc's latest earnings report shows a significant miss, raising concerns about its operational efficiency and future prospects.
GoldMining Inc (GOLD.TO) reported its earnings for the fiscal period ending May 31, 2026, after the market closed on July 17, 2026. The company posted an earnings per share (EPS) of -$0.0395, which fell short of analysts' expectations of -$0.03. This represents a surprising miss of 31.67%, leading to a notable decline in investor sentiment following the release.
Recent earnings trend
Advertisement

Get up to $2,000 cash back
Open and fund a new Qtrade account with promo code SPRING26. Offer ends July 31, 2026.
GoldMining Inc
GOLD.TO
GOLD.TO
GoldMining Inc
 WealthAwesome
Market cap
$254.66M
52W high
$3.10
52W low
$1.03
1W change
-4.80%
Beta
1.79
Analyst Price Targets
Based on analyst covering GOLD
Wall Street analysts forecast GOLD stock price to rise 227.7% over the next 12 months.
Consensus
BullishBased on avg. target vs last close (formal rating unavailable for Canadian listings)
Avg. Target
C$3.90
+227.7% Upside
Current Price
C$1.19
Last close
Analyst ratings and price targets are updated periodically. Not financial advice.
Wealth Awesome Price Forecast
WA ModelStatistical 90-day price range based on GOLD's historical volatility
30-Day Vol
68.7%
Annualized
90-Day Vol
60.5%
Annualized
Trend (90d)
-50.0%
Annualized drift
90d Mean
C$1.00
Expected price
| Horizon | Expected | 68% Range (1σ) |
|---|---|---|
| 30 trading days | C$1.12 | C$0.88 – C$1.42 |
| 60 trading days | C$1.06 | C$0.76 – C$1.48 |
| 90 trading days | C$1.00 | C$0.66 – C$1.50 |
Methodology: Range is calculated using 30-day realized volatility via geometric Brownian motion (log-normal model). 68% band = ±1σ, 95% band = ±2σ. This is a statistical model, not a prediction. Past volatility does not guarantee future results. Not financial advice.
Analyst coverage: 1 analyst(s) cover this name; upcoming EPS consensus is available.
Beat estimates in 1 of the last 4 comparable quarter(s).
| Fiscal period | Report date | Actual EPS | Estimate | Surprise |
|---|---|---|---|---|
| 2026-05-31 | 2026-07-17 | -0.0395 | -0.0300 | -31.7% |
| 2026-02-28 | 2026-04-10 | -0.0300 | -0.0300 | +0.0% |
| 2025-11-30 | 2026-02-27 | -0.0400 | -0.0300 | -33.3% |
| 2025-08-31 | 2025-10-10 | 0.0019 | -0.0300 | +106.3% |
| 2025-05-31 | 2025-07-14 | -0.0100 | -0.0300 | +66.7% |
| 2025-02-28 | 2025-04-11 | -0.0200 | -0.0300 | +33.3% |
Investor takeaway: For Canadian investors, GoldMining's earnings miss highlights the volatility and risks of investing in the mining sector, especially in a fluctuating commodity market. While the company has substantial cash reserves and potential project valuations that offer some hope, its operational performance remains a critical concern.
-31.67% Earnings Surprise
GoldMining's EPS of -$0.0395 starkly contrasts with the expected -$0.03, marking a significant deviation that raises concerns about the company's operational efficiency.
Bull case
GoldMining has around US$185 million in cash and publicly traded securities, nearly matching its market capitalization. The company is also making progress on its projects, with promising preliminary economic assessments suggesting significant potential value in its portfolio.
Bear case
The earnings miss and the ongoing trend of negative EPS growth highlight operational challenges that could hinder GoldMining's ability to leverage its asset potential. Investors should be cautious about the company's ability to improve its financial performance in a competitive and volatile mining landscape.
Advertisement