CIBC Investor's Edge
Transfer your investments to CIBC Investor's Edge and get rewarded with an offer of up to $3,000.
- ✓$6.95 flat-rate commissions
- ✓Backed by Big Five bank security
- ✓Transfer bonus offer up to $3,000

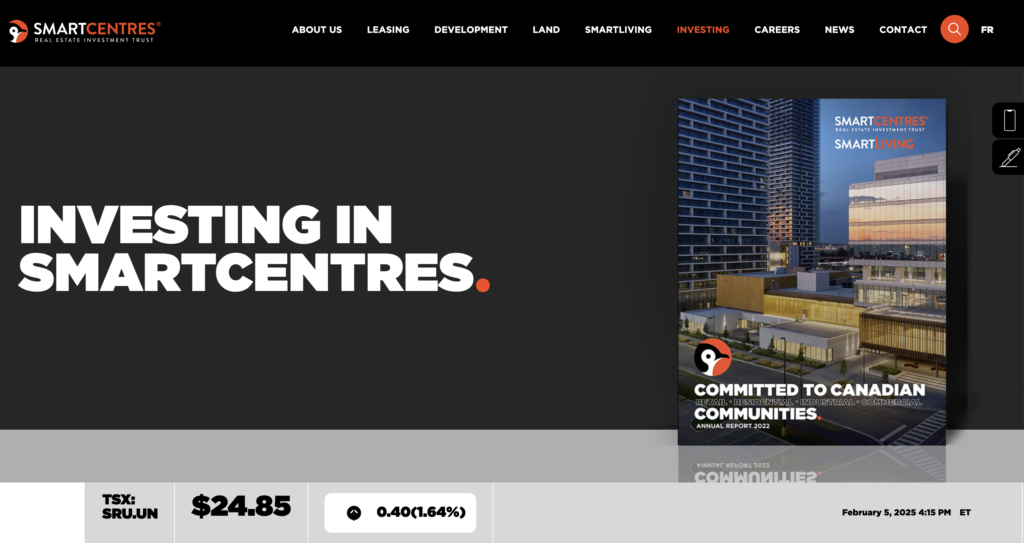
SmartCentres Real Estate Investment Trust (TSX: SRU.UN) is one of Canada’s largest fully integrated real estate investment trusts (REITs). With a high-quality, mixed-use portfolio featuring 191 strategically located properties, SmartCentres is well-positioned as a stable, high-yield dividend I'llstock for long-term investors.
This REIT boasts a 7.0% dividend yield, underpinned by strong occupancy rates (98.5%) and a $12 billion asset base. SmartCentres continues to expand into residential and mixed-use developments, enhancing its long-term value proposition.
Company Overview: SmartCentres REIT (TSX: SRU.UN)
SmartCentres focuses on value-oriented retail and mixed-use properties, catering to high-traffic locations across Canada. The company’s key strengths include:
-
Large-Scale Real Estate Holdings – Owns 35 million square feet of income-producing retail and office space.
-
Prime Locations – Properties situated in high-demand urban and suburban areas with strong consumer traffic.
-
Development Pipeline – Actively expanding its footprint with mixed-use projects, including SmartLiving residential communities.
Key Business Segments
-
Retail Properties
-
Anchored by major retailers like Walmart, making up 25% of rental revenue.
-
High occupancy rates ensure stable cash flows.
-
-
Mixed-Use Developments
-
Transitioning properties into urban communities with residential, office, and retail spaces.
-
"SmartLiving" initiative aims to build 50+ high-rise residential towers over the next decade.
-
-
Industrial & Office Space
- Expanding its logistics and office portfolio to diversify income streams.
Recent News & Developments
SmartCentres REIT has remained active in expanding its portfolio and strengthening its financial position:
📌 $300 Million Bond Issuance – Closed a $300 million Series Y bond offering, reinforcing its liquidity and balance sheet strength. (Source)
📌 New Residential Projects Underway – SmartLiving expansion continues with major residential projects in Vaughan, Toronto, and Montreal. (Source)
📌 Dividend Sustainability – Declared its December 2024 distribution, affirming stable monthly payouts for investors. (Source)
📌 Solid Q3 Performance – Posted consistent rental income growth, reflecting strong tenant demand and high occupancy rates. (Source)
SmartCentres’ focus on mixed-use development and debt refinancing demonstrates its commitment to long-term growth and dividend stability.
Stock Performance Analysis: SmartCentres REIT (TSX: SRU.UN)
SmartCentres stock has been steady in 2024, supported by stable cash flows and rising demand for mixed-use developments.
Why is Stock is Attractive
✔ 7.0% Dividend Yield – Consistent payouts, backed by strong rental income.
✔ 98.5% Occupancy Rate – High tenant retention ensures revenue stability.
✔ Growing Mixed-Use Developments – Expansion into residential real estate supports long-term growth.
✔ Financially Secure – Strong balance sheet with $12 billion in assets.
[custom_wpdatatable id=9]
[wpdatachart id=4]
Peer Comparison: SmartCentres REIT (SRU-UN.TO) vs. Industry Peers
| Code | Name | GIC Sector | Market Cap | Beta | 52-Week High | 52-Week Low | 50-Day MA | 200-Day MA | Shares Short | Short Ratio | Short Percent |
|---|---|---|---|---|---|---|---|---|---|---|---|
| FSV | FirstService Corp | Real Estate | 11.26B | 0.943 | 277.92 | 193.15 | 264.95 | 238.82 | 111,263 | 2.93 | 0.0094 |
| CIGI | Colliers International Group Inc Bats | Real Estate | 10.36B | 1.645 | 218.47 | 137.99 | 202.65 | 185.02 | 278,265 | 3.94 | 0.0413 |
| CHP-UN | Choice Properties Real Estate Investment Trust | Real Estate | 9.34B | 0.661 | 15.27 | 12.20 | 13.42 | 13.73 | 1,462,213 | 3.48 | 0.0081 |
| CAR-UN | Canadian Apartment Properties REIT | Real Estate | 7.08B | 1.235 | 56.58 | 39.23 | 42.70 | 46.61 | 1,637,013 | 3.13 | 0.0082 |
| REI-UN | RioCan Real Estate Investment Trust | Real Estate | 5.47B | 1.315 | 20.54 | 15.79 | 18.49 | 18.36 | 4,337,752 | 6.45 | 0.0092 |
| CSH-UN | Chartwell Retirement Residences | Real Estate | 4.46B | 1.126 | 16.50 | 11.40 | 15.59 | 14.45 | 610,618 | 1.81 | 0.011 |
| GRT-UN | Granite Real Estate Investment Trust | Real Estate | 4.37B | 1.181 | 81.34 | 62.58 | 71.32 | 72.71 | 680,476 | 6.49 | 0.0043 |
| SRU-UN | SmartCentres Real Estate Investment Trust | Real Estate | 4.17B | 1.255 | 27.02 | 20.73 | 24.89 | 24.34 | 3,074,735 | 9.06 | 0.0162 |
| FCR-UN | First Capital Real Estate Investment Trust | Real Estate | 3.49B | 1.28 | 18.91 | 13.95 | 17.17 | 16.66 | 1,451,973 | 4.88 | 0.0043 |
| BEI-UN | Boardwalk Real Estate Investment Trust | Real Estate | 3.45B | 1.76 | 91.03 | 59.53 | 65.03 | 73.82 | 232,104 | 1.36 | 0.0231 |
📌 This table compares SmartCentres REIT ([SRU-UN.TO](http://SRU-UN.TOhttps://wealthawesome.com/stock/sru-un-to/)) with its real estate industry peers, showcasing key financial metrics such as market capitalization, stock performance, short interest, and volatility (beta). Investors can use this data to evaluate how SmartCentres REIT stacks up against competitors in the Canadian REIT sector.
Valuation Metrics: SmartCentres REIT (TSX: SRU.UN)
| Metric | Current | 9/30/2024 | 6/30/2024 | 3/31/2024 | 12/31/2023 | 9/30/2023 |
|---|---|---|---|---|---|---|
| Market Cap | 4.23B | 4.53B | 3.74B | 3.96B | 4.24B | 3.88B |
| Enterprise Value | 9.22B | 9.58B | 8.75B | 8.92B | 9.24B | 8.84B |
| Trailing P/E | 31.81 | 16.22 | 12.28 | 9.56 | 8.74 | 12.08 |
| Forward P/E | 13.11 | 13.76 | 11.55 | 11.82 | 12.20 | 11.05 |
| PEG Ratio (5yr expected) | -- | -- | -- | -- | -- | -- |
| Price/Sales | 4.71 | 5.26 | 4.45 | 4.74 | 5.11 | 4.72 |
| Price/Book | 0.81 | 0.87 | 0.72 | 0.75 | 0.80 | 0.74 |
| Enterprise Value/Revenue | 10.25 | 11.11 | 10.40 | 10.69 | 11.14 | 10.77 |
| Enterprise Value/EBITDA | 26.46 | 18.55 | 15.87 | 13.10 | 12.07 | 16.01 |
📌 This table outlines SmartCentres REIT's valuation metrics over time, reflecting trends in market capitalization, price-to-earnings ratios, and enterprise value ratios. Investors can use this data to assess the stock’s valuation in comparison to past performanc. ****
TL;DR Summary: Is SmartCentres' 7% Yield Safe?
✔ Strong Dividend Coverage – REIT's cash flow supports stable payouts.
✔ High Occupancy Rate – 98.5% tenant retention minimizes risk.
✔ Mixed-Use Growth – Expansion into residential real estate adds long-term value.
✔ Resilient Financials – Debt refinancing secures liquidity for future investments.
👉 Final Verdict: SmartCentres REIT remains a strong buy for income investors looking for a reliable 7.0% yield.
Final Thoughts
With high occupancy rates, a solid development pipeline, and a stable dividend, SmartCentres remains a top-tier Canadian REIT. Its 7.0% dividend yield is well-supported by rental income, making it a safe and attractive investment for long-term dividend seekers.
Would you like any modifications or additional insights? 🚀
Best next step
Keep exploring this topic
If you want to go deeper, these are the most useful follow-up pages and tools for this topic.
Stocks tool
Check Canadian stock movers
See the latest TSX and TSXV winners and losers before digging deeper into a sector.
Research hub
Browse Canadian stock research
Use the stock section to jump from a theme article into individual company pages.
Diversification
Compare stocks with ETF options
If you want exposure to a theme without single-stock risk, screen matching ETFs instead.
Advertisement
7 stocks to buy and hold forever
Proven winners for income investors — blue-chip dividend stocks to hold for decades.
Get the FREE Report
Qayyum Rajan, CFA
Qayyum is the CEO of Wealth Awesome, a leading Canadian personal finance publication. As a CFA charterholder with extensive experience in fintech, data science, and quantitative finance, he brings a unique analytical perspective to investing and wealth management.
View Full Profile →✅ Reviewed by Certified Financial Professionals
This content has been reviewed by CFA® charterholders and Certified Financial Planners (CFP®) with over a decade of experience in Canadian financial markets. All information is fact-checked against official Canadian sources and regulations.
Why these credentials matter: CFA® charterholders complete 900+ hours of rigorous study in investment analysis and ethics. CFP® professionals are held to the highest standards of financial planning competency and fiduciary duty in Canada.
⚠️ Professional Disclaimer
This content is for educational purposes only and should not be considered personalized financial advice. While our team brings professional expertise, individual circumstances vary. For personalized guidance, consult with a qualified financial advisor, tax professional, or mortgage specialist.